
MMI plugin for WooCommerce
Real-Time Server Monitor – Live Server Health for WordPress
Live server health for WordPress: load, CPU, memory and visitors at a glance, with likely bad visitors flagged.
Price range: $49.00 through $199.00 / year
Inside the plugin
The admin screens
Every MMI plugin runs our own store on mannmade.us before it ships. These are its real screens; anything that would show our store data is drawn as a placeholder bar.
Shimmering bars stand in for customer, product and order data.
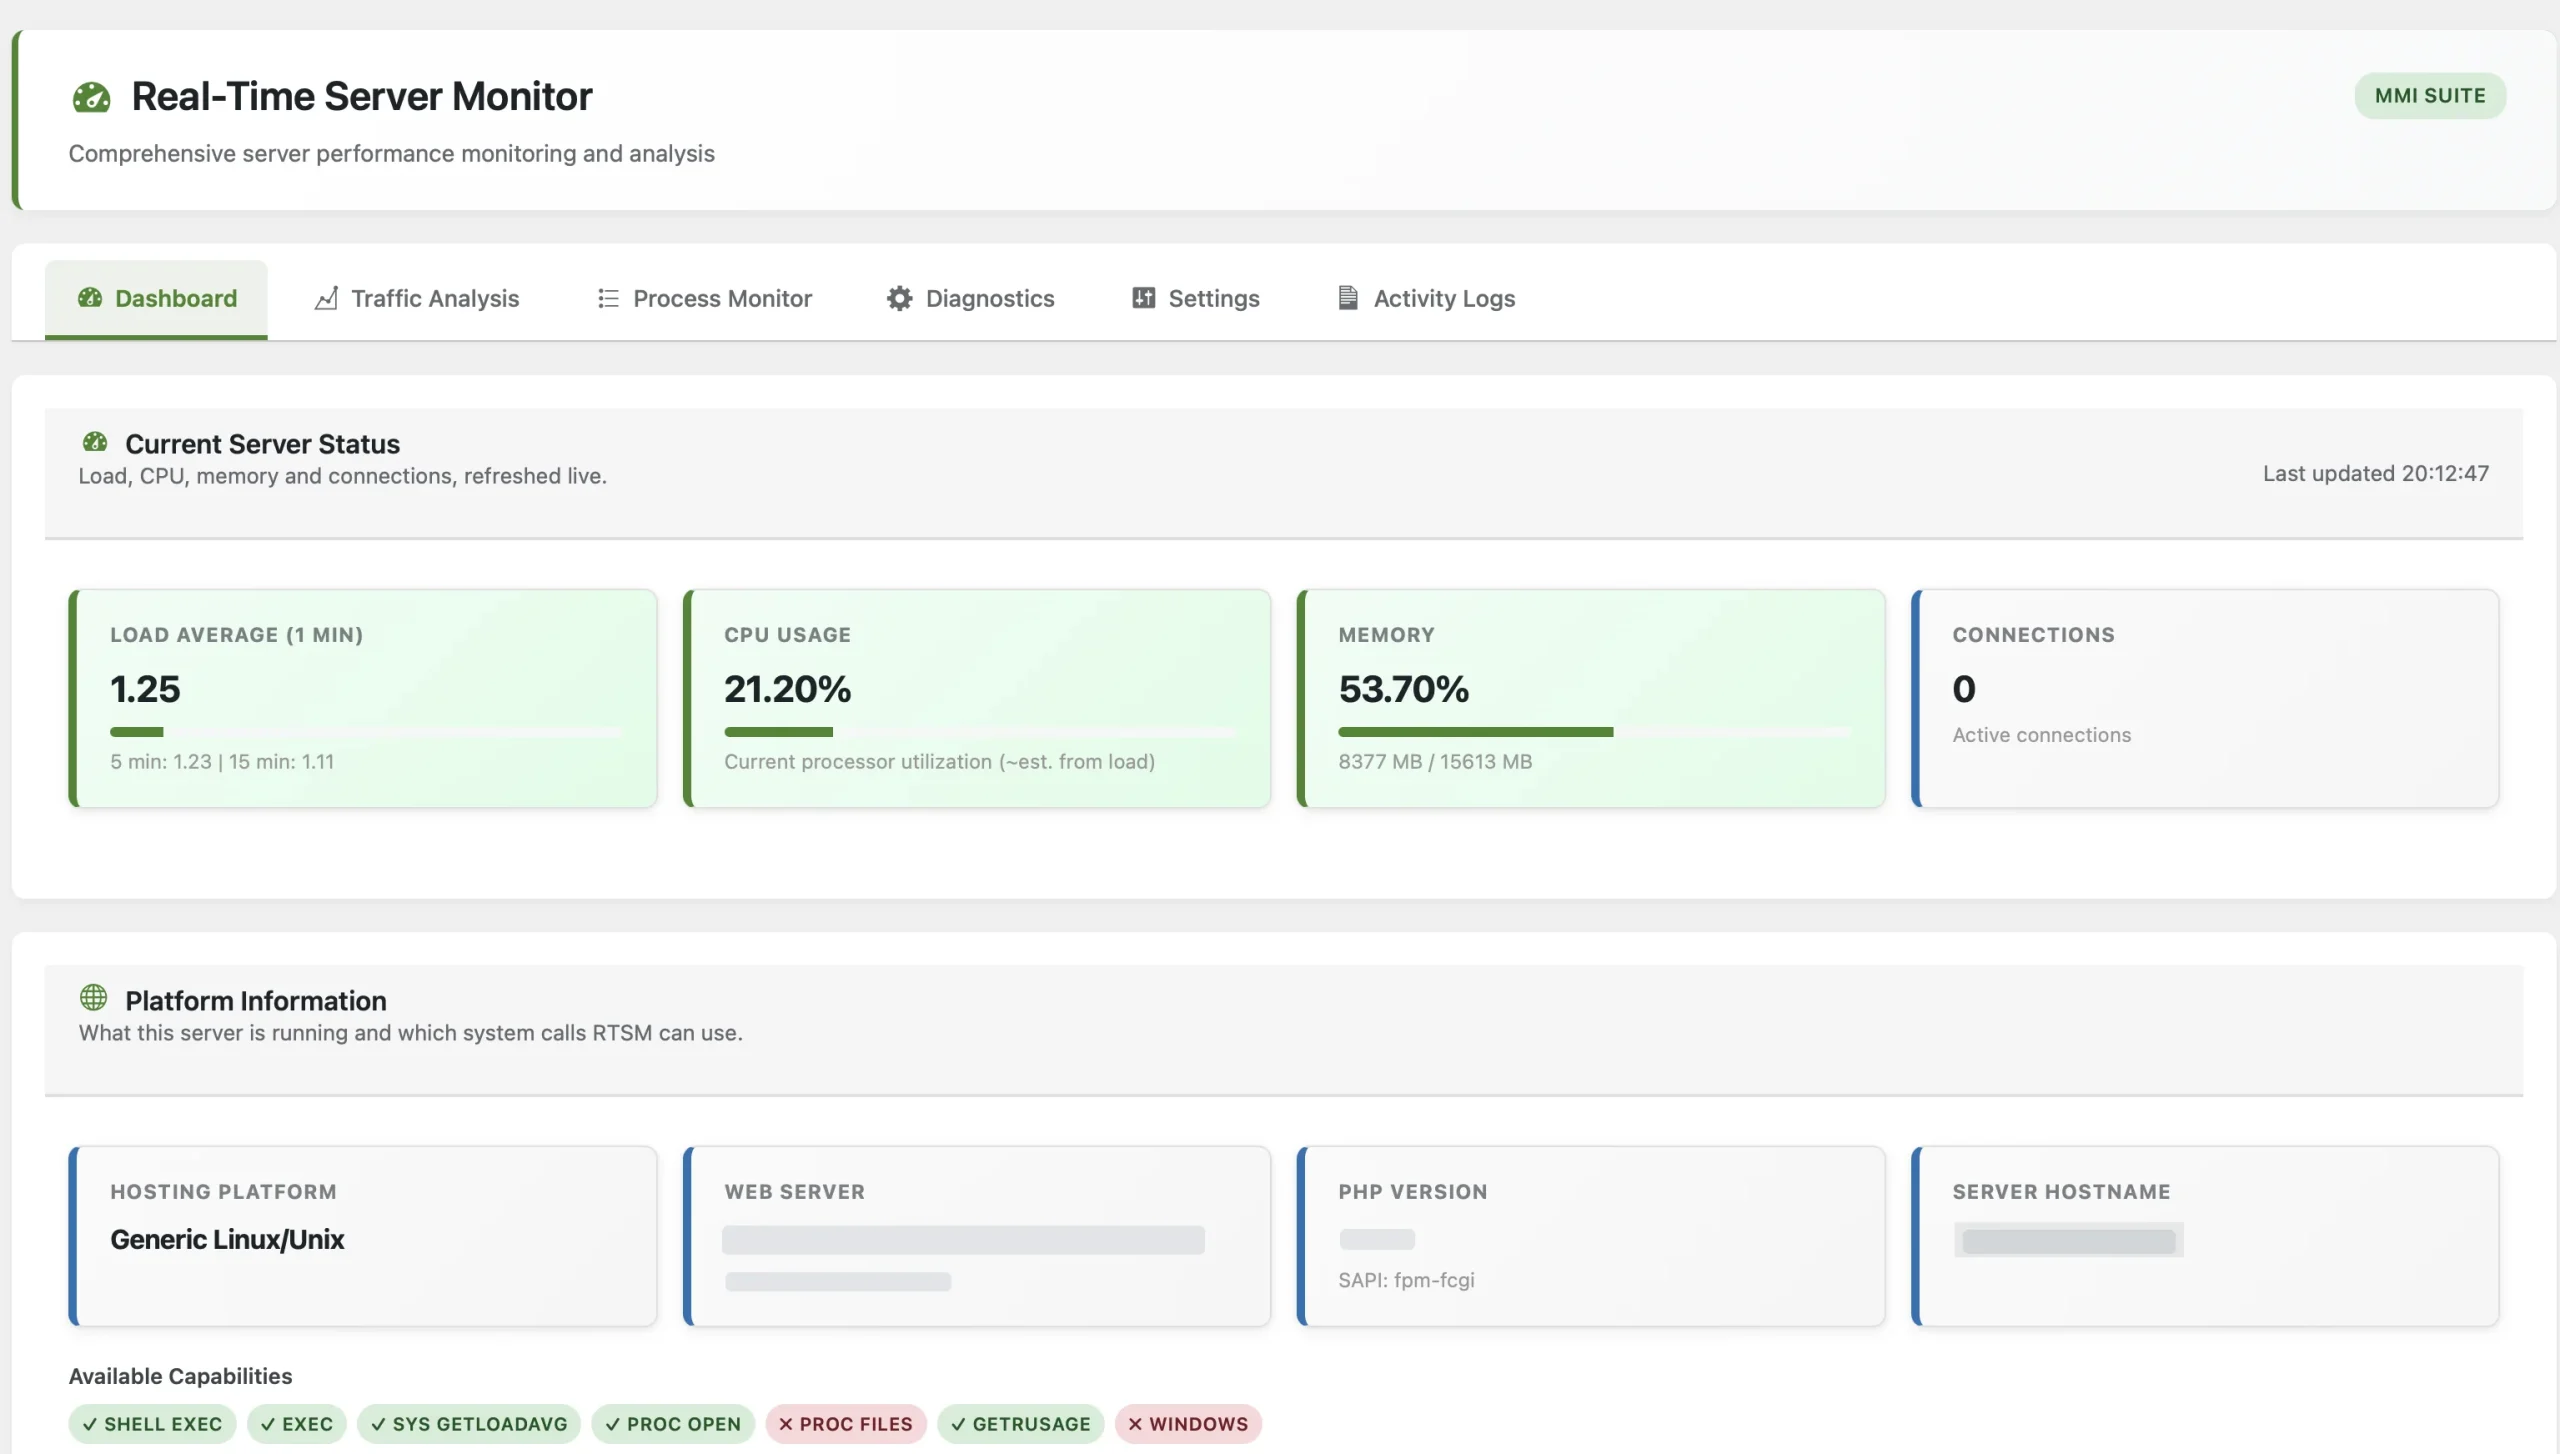
Server dashboard
Load, CPU, memory and visitors, refreshed live.
- Load average for 1, 5 and 15 minutes, with a usage bar
- CPU and memory use, with memory shown as used against total
- Platform information: hosting platform, web server, PHP version and hostname
- Badges show which system calls the plugin can use on this server
- Visitors: who reached the site, labelled from their last 6 hours, with filters from 15 minutes to 24 hours
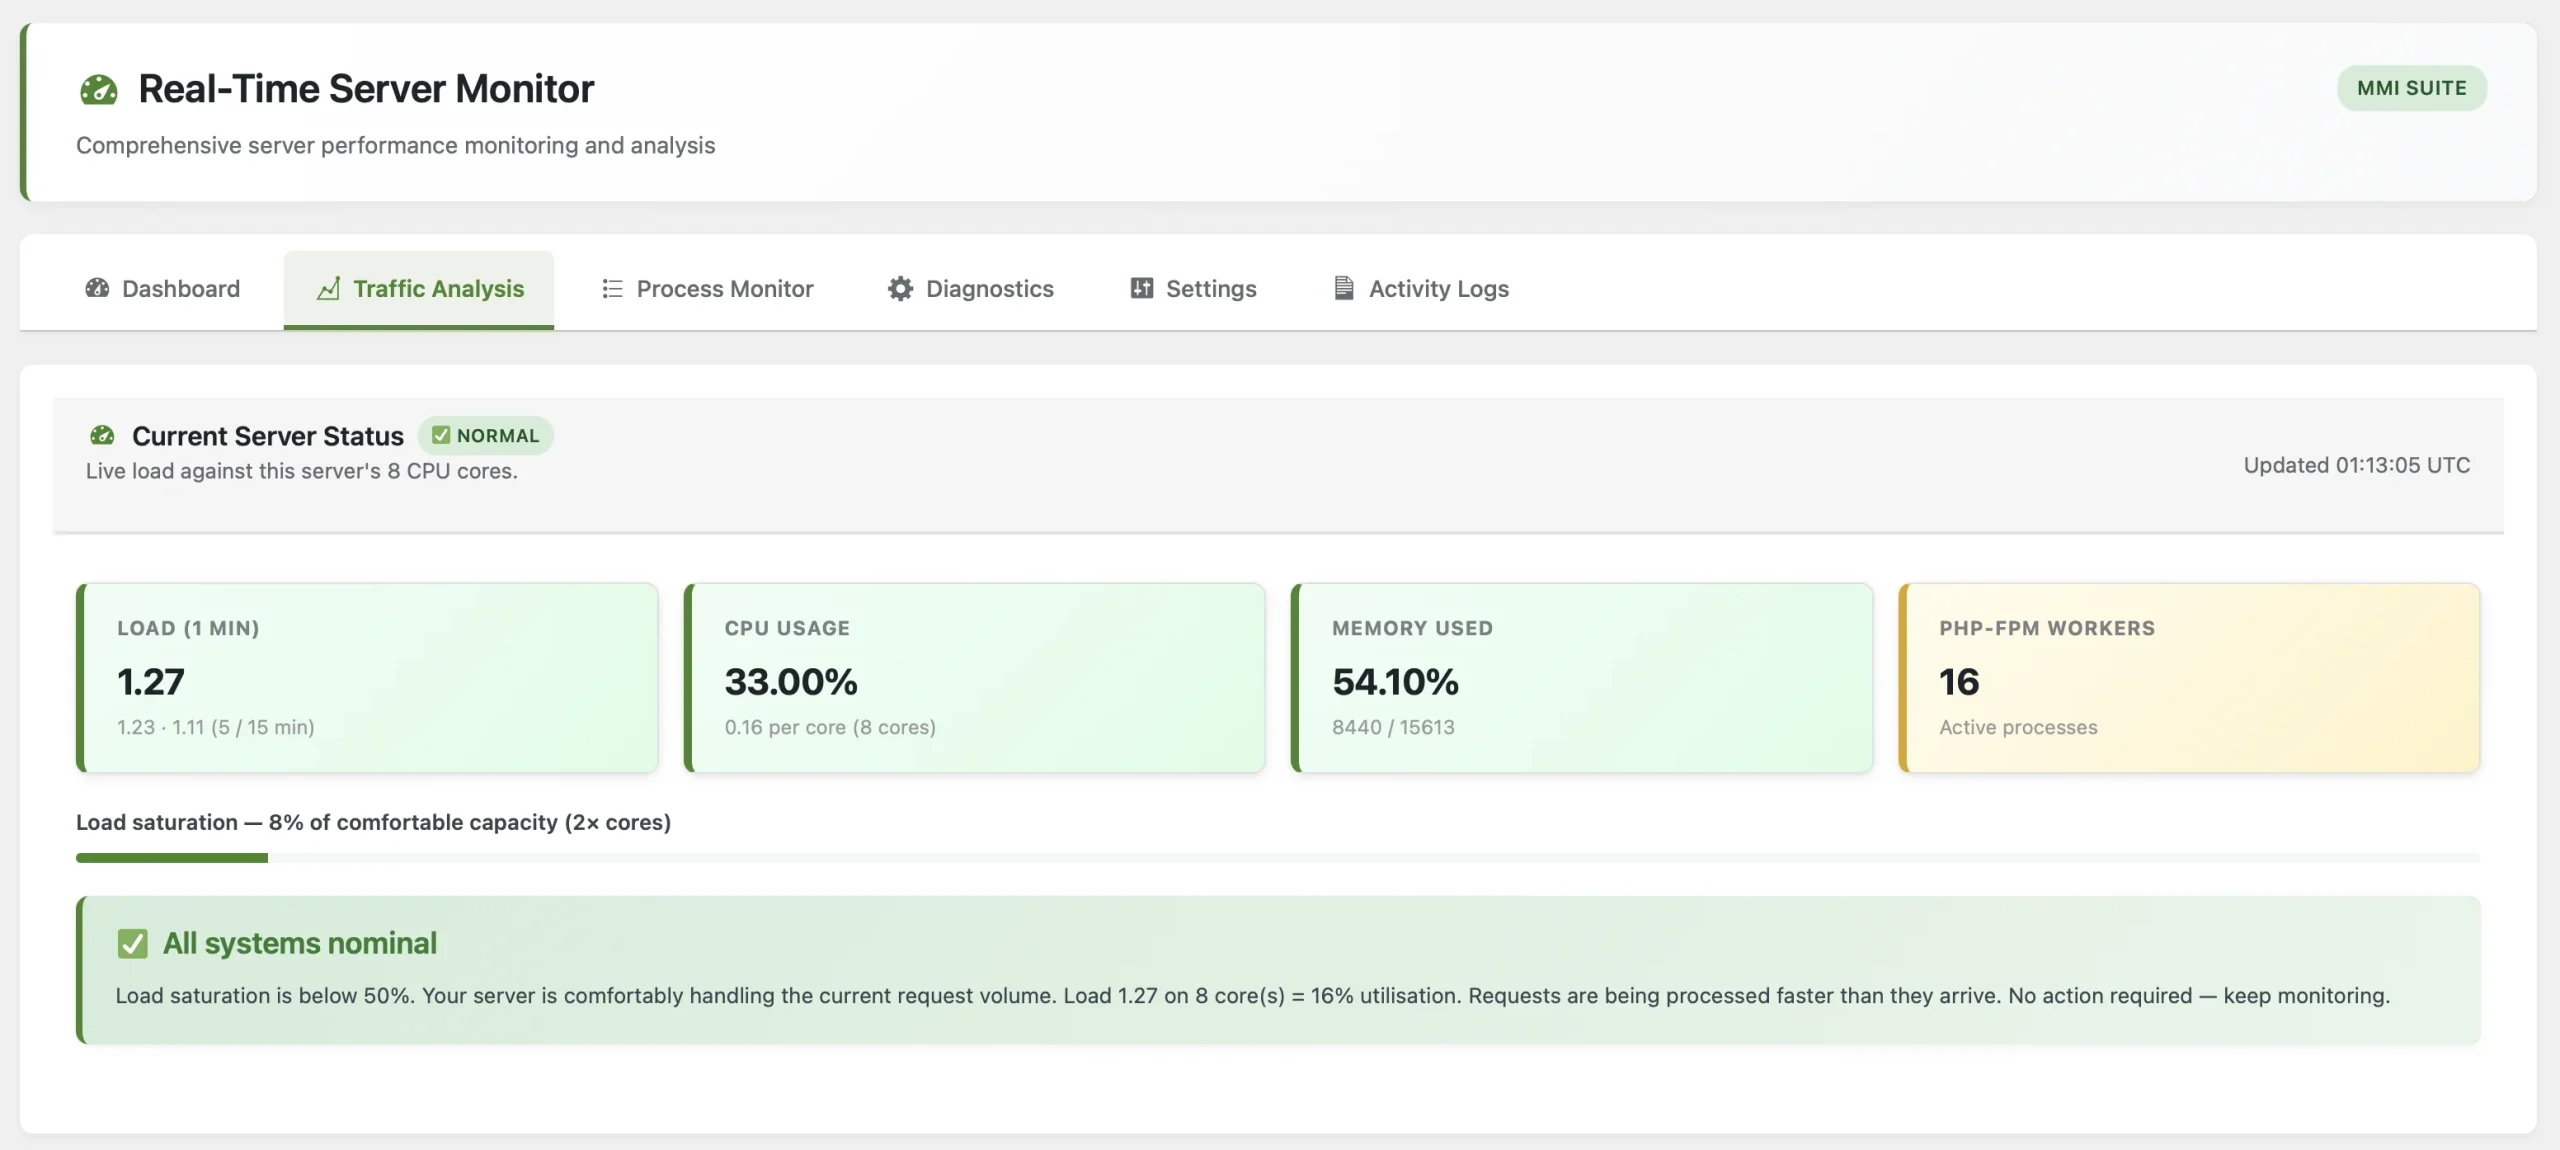
Traffic analysis
Live load measured against the server's own CPU cores.
- A status badge for the server's current state
- Load, CPU, memory used and active PHP-FPM workers
- Load saturation as a share of comfortable capacity (2× cores)
- A plain-language verdict that says whether any action is needed
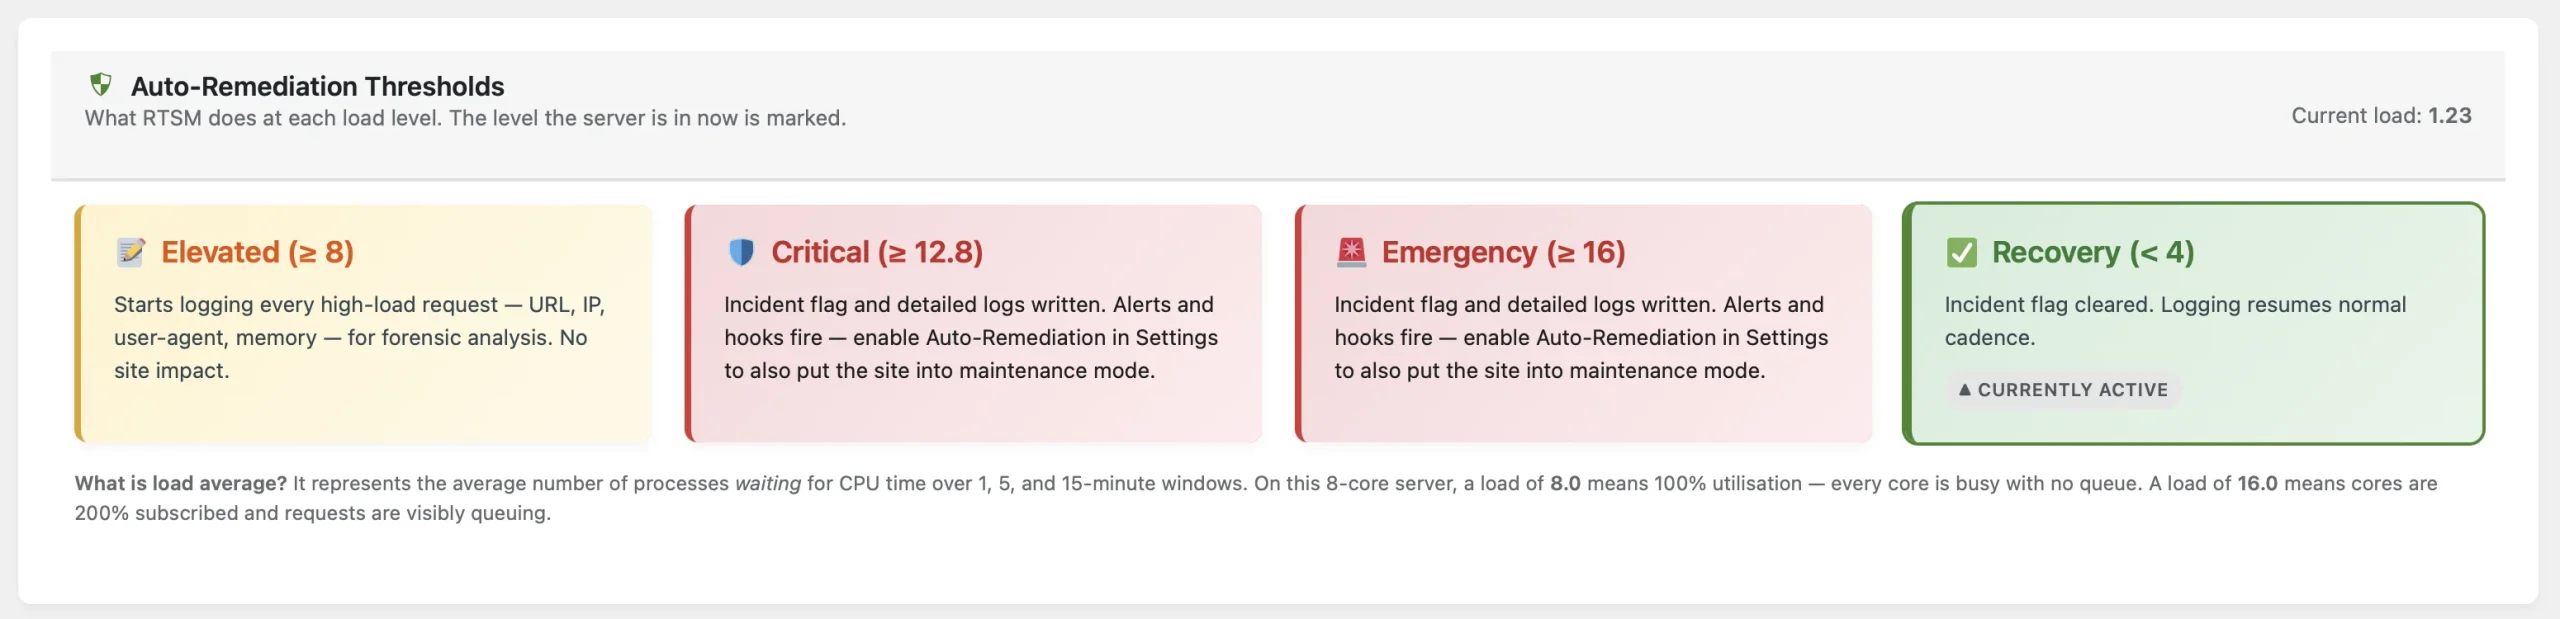
Auto-remediation thresholds
What the plugin does at each load level, with the current level marked.
- Elevated, Critical, Emergency and Recovery levels, each with the load that triggers it
- Elevated logs every high-load request (URL, IP, user agent, memory) for later analysis
- Critical and Emergency set an incident flag, write detailed logs, and fire alerts and hooks
- A short explainer of what load average means on this server's core count
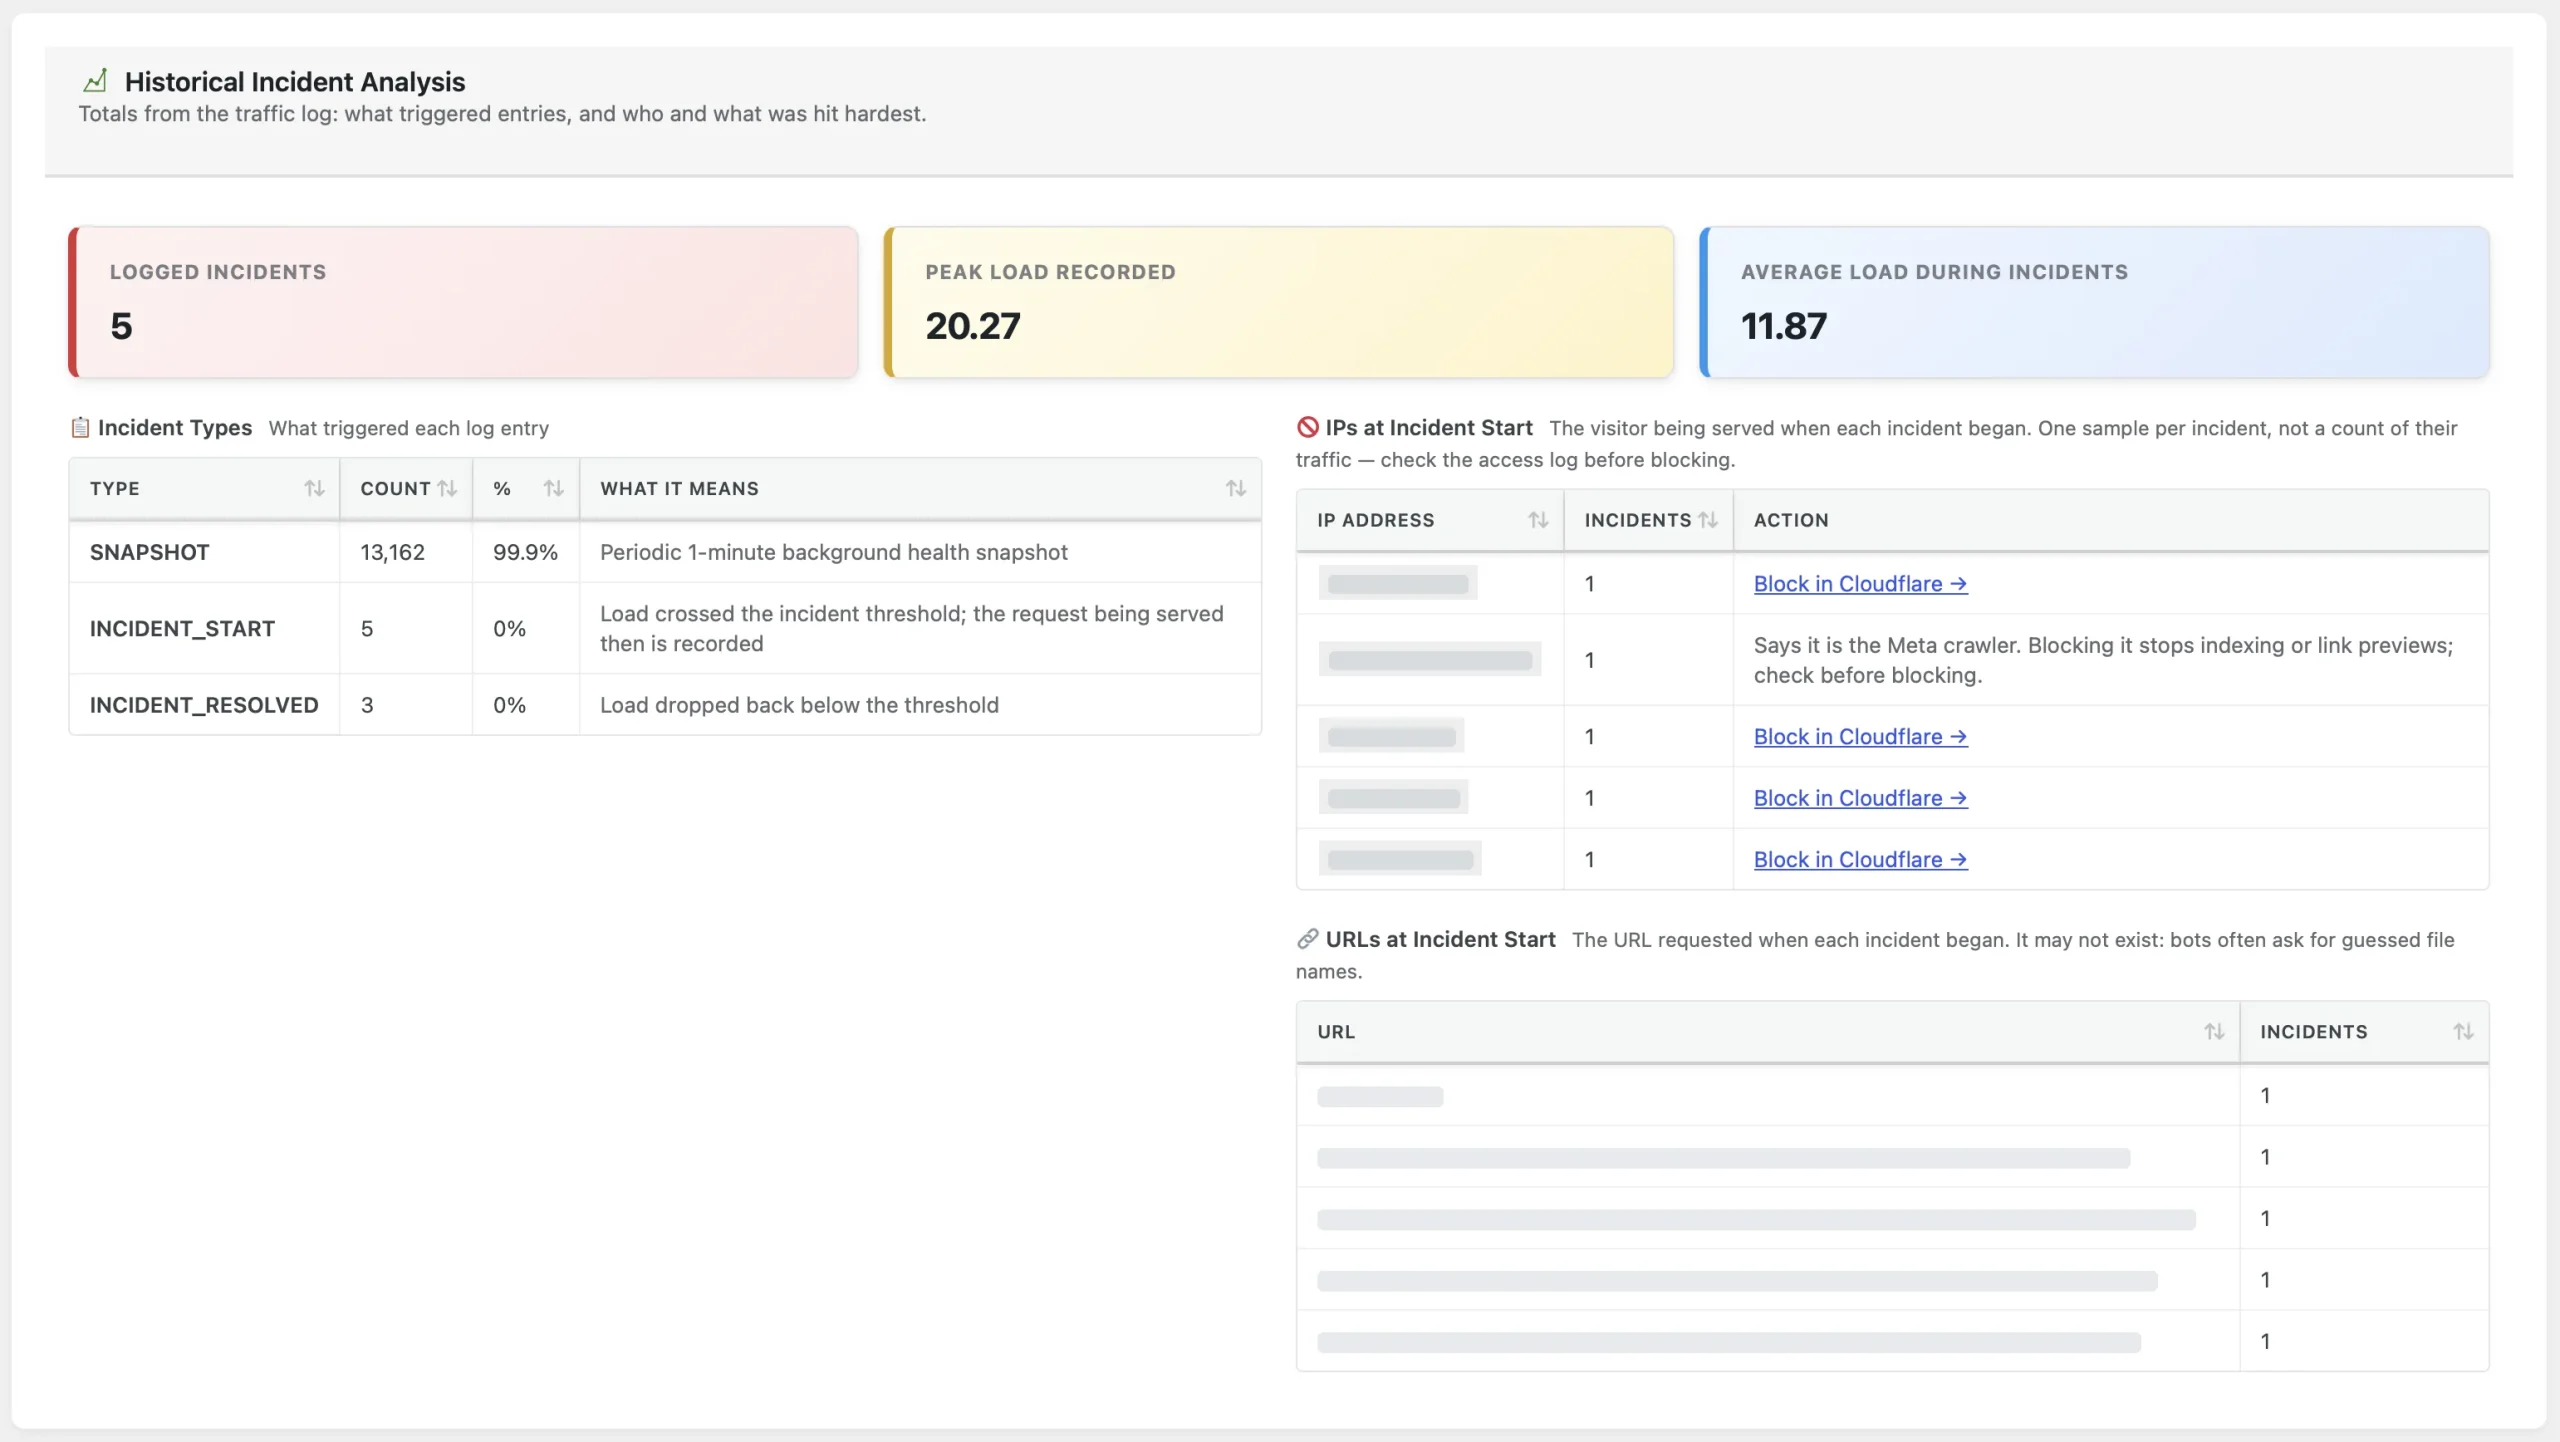
Historical incident analysis
What triggered log entries, and who and what was hit hardest.
- Logged incidents, peak load and average load during incidents
- Incident types with counts and what each one means
- The visitor IP at each incident start, with a Block in Cloudflare link and a warning before blocking a known crawler
- The URL requested when each incident began
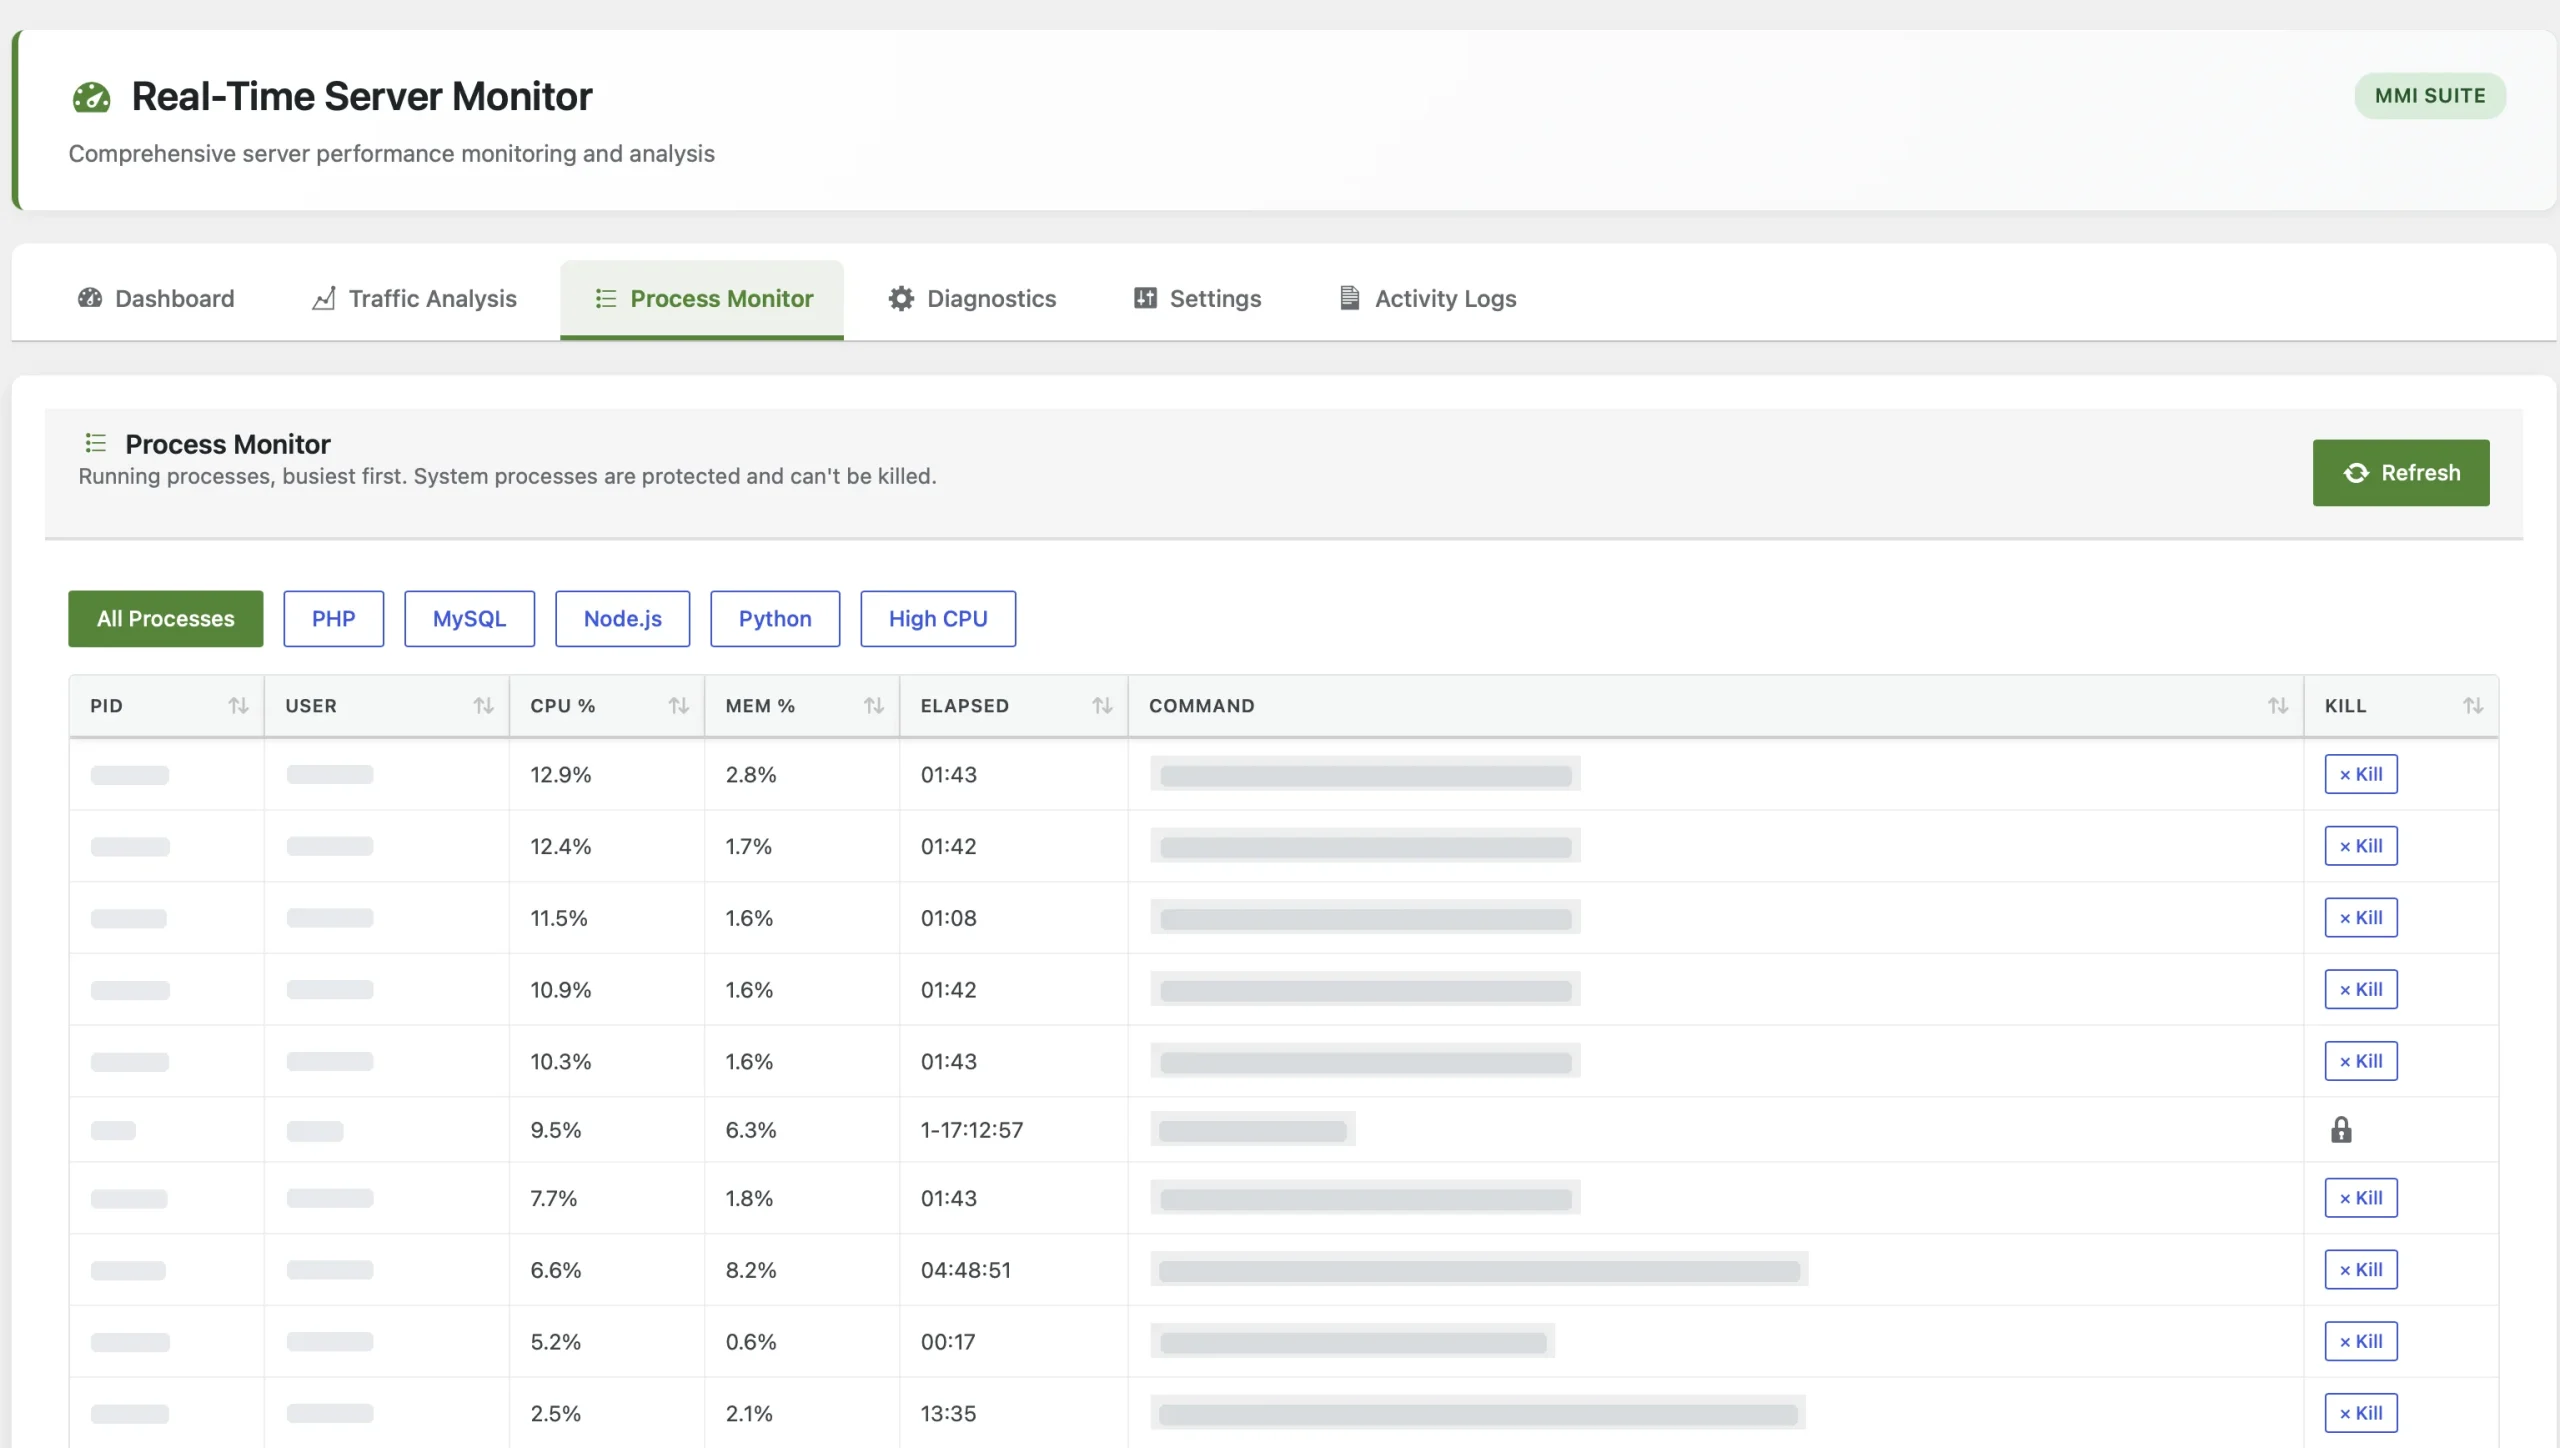
Process monitor
Running processes, busiest first.
- PID, user, CPU %, memory %, elapsed time and command for each process
- Filter to PHP, MySQL, Node.js, Python or high-CPU processes
- Kill a runaway process from its row; system processes are locked
- Sort on any column
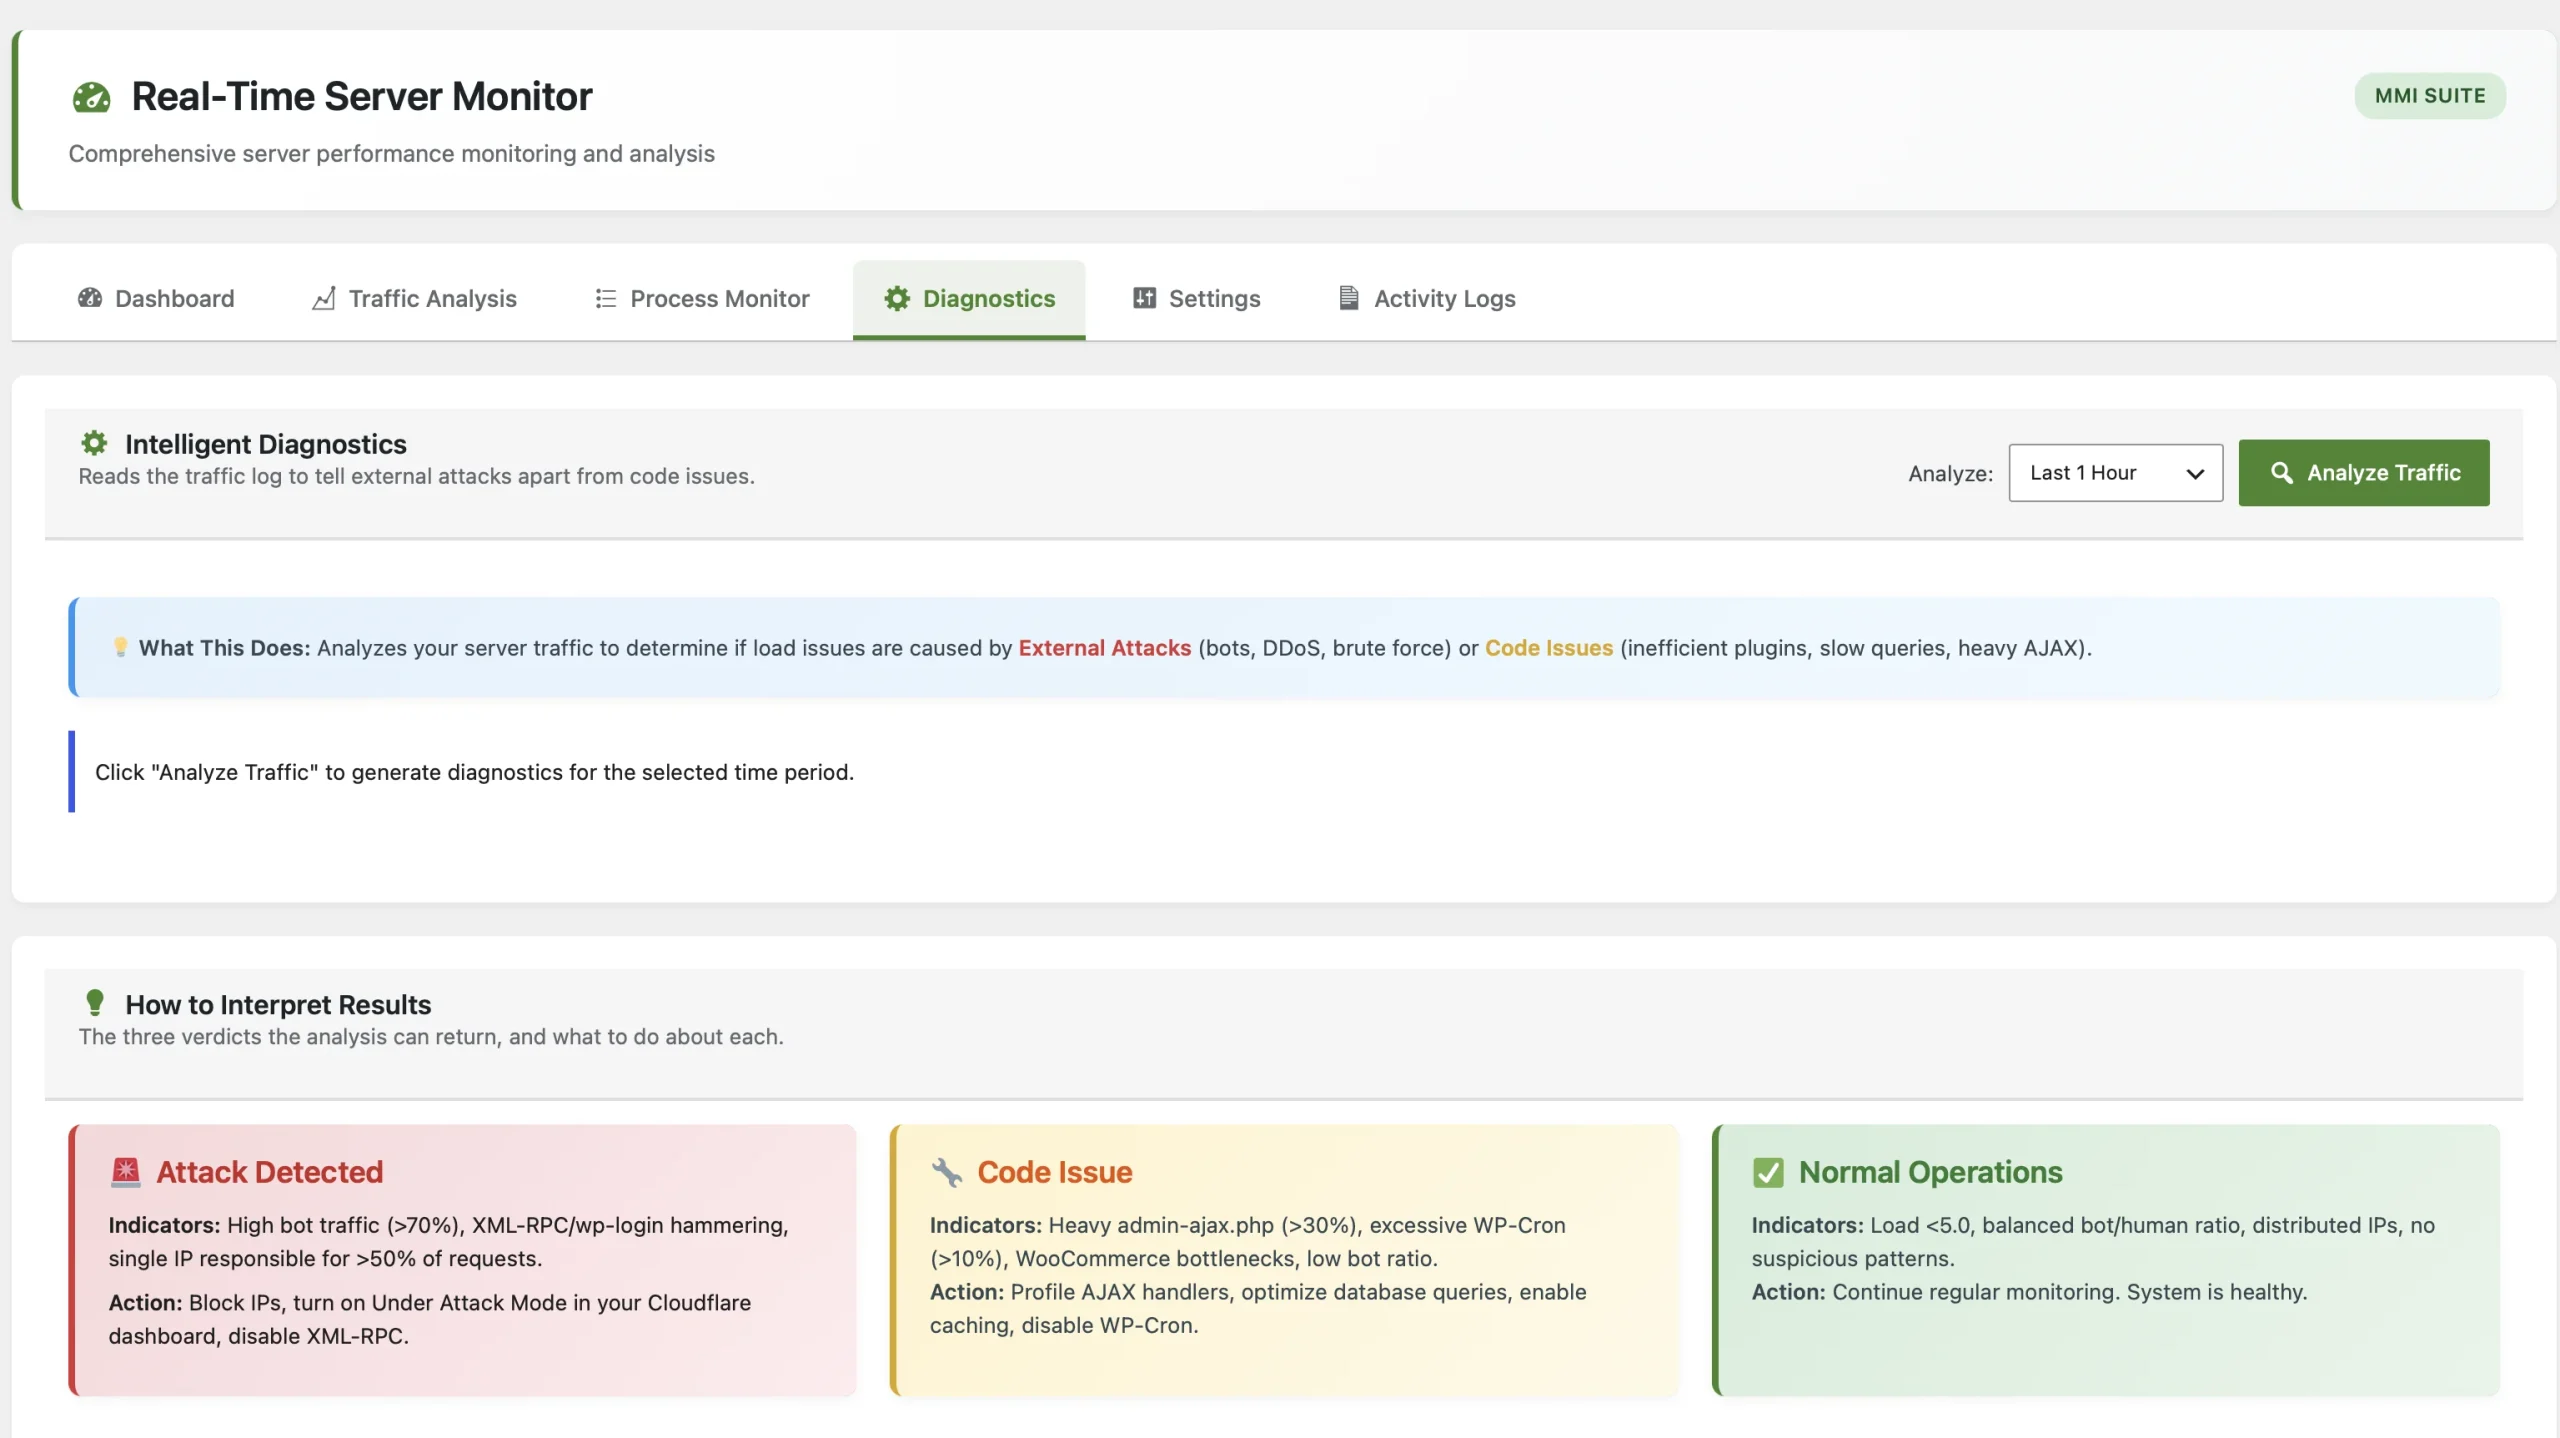
Intelligent diagnostics
Reads the traffic log to tell external attacks apart from code issues.
- Pick a time period and click Analyze Traffic
- Three verdicts: Attack Detected, Code Issue and Normal Operations
- Each verdict lists its indicators and the action to take
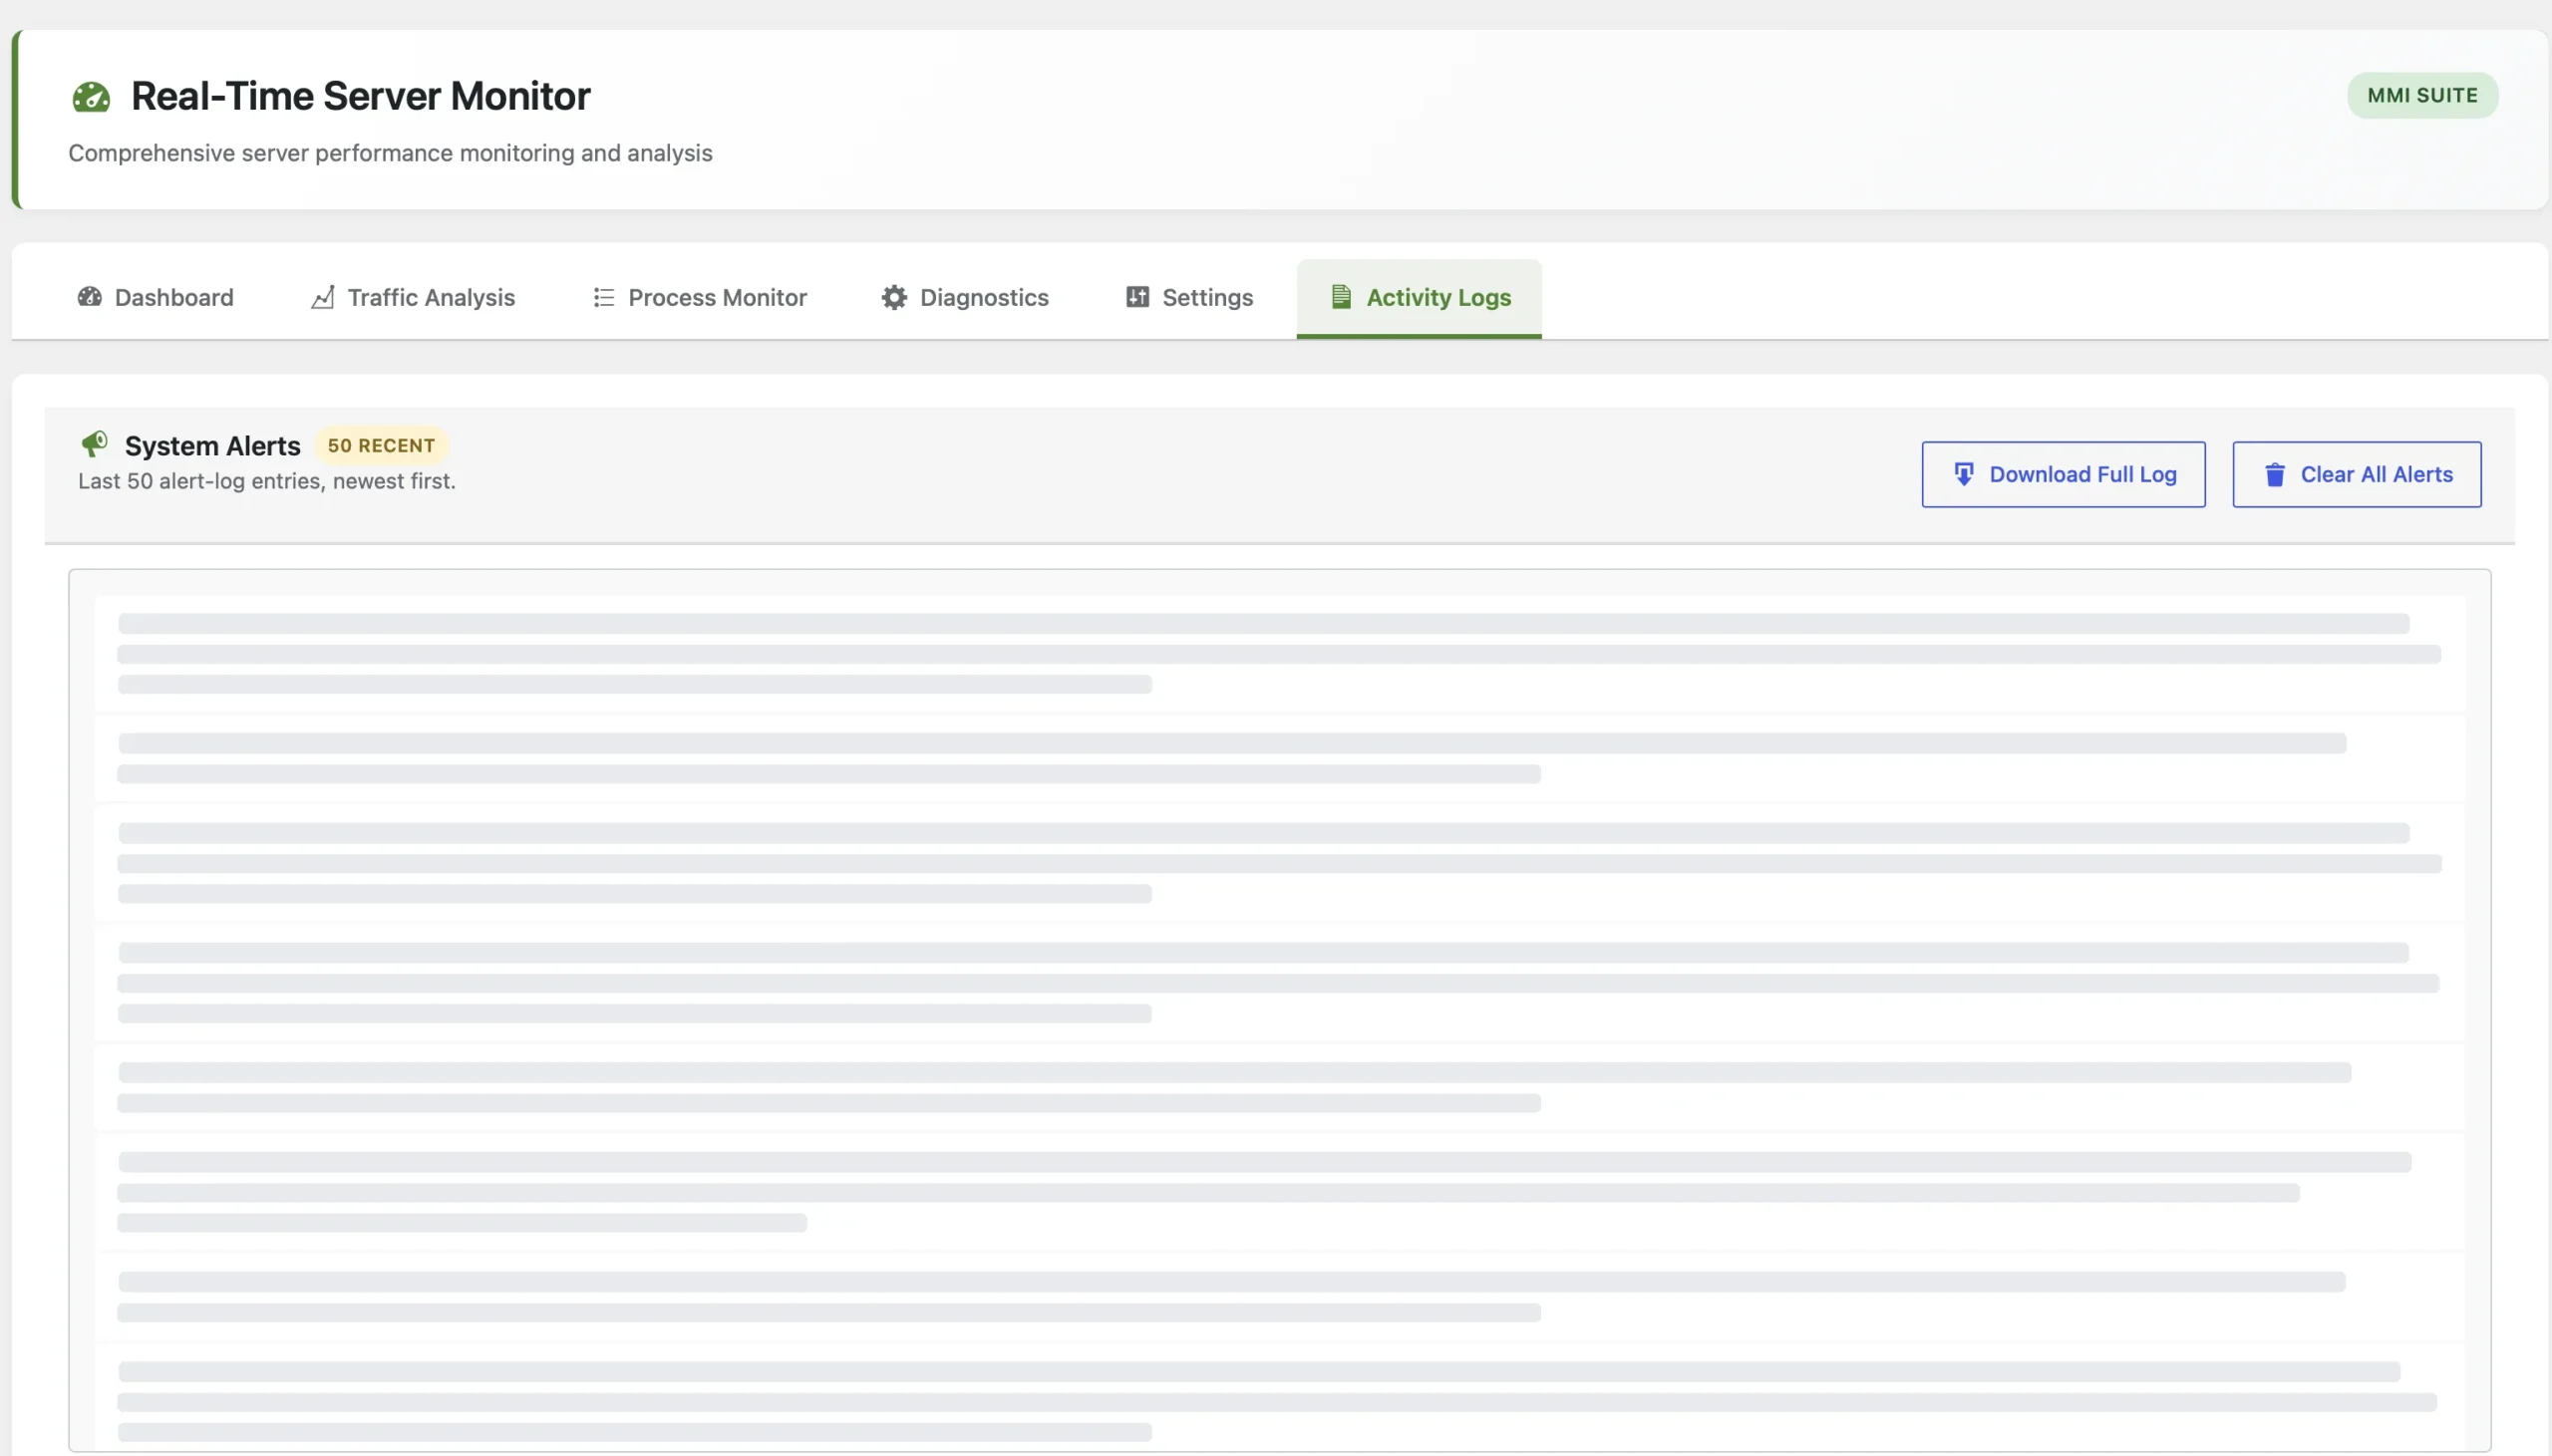
System alerts
The alert log, newest entries first.
- The 50 most recent alert entries
- Download the full log
- Clear all alerts in one click
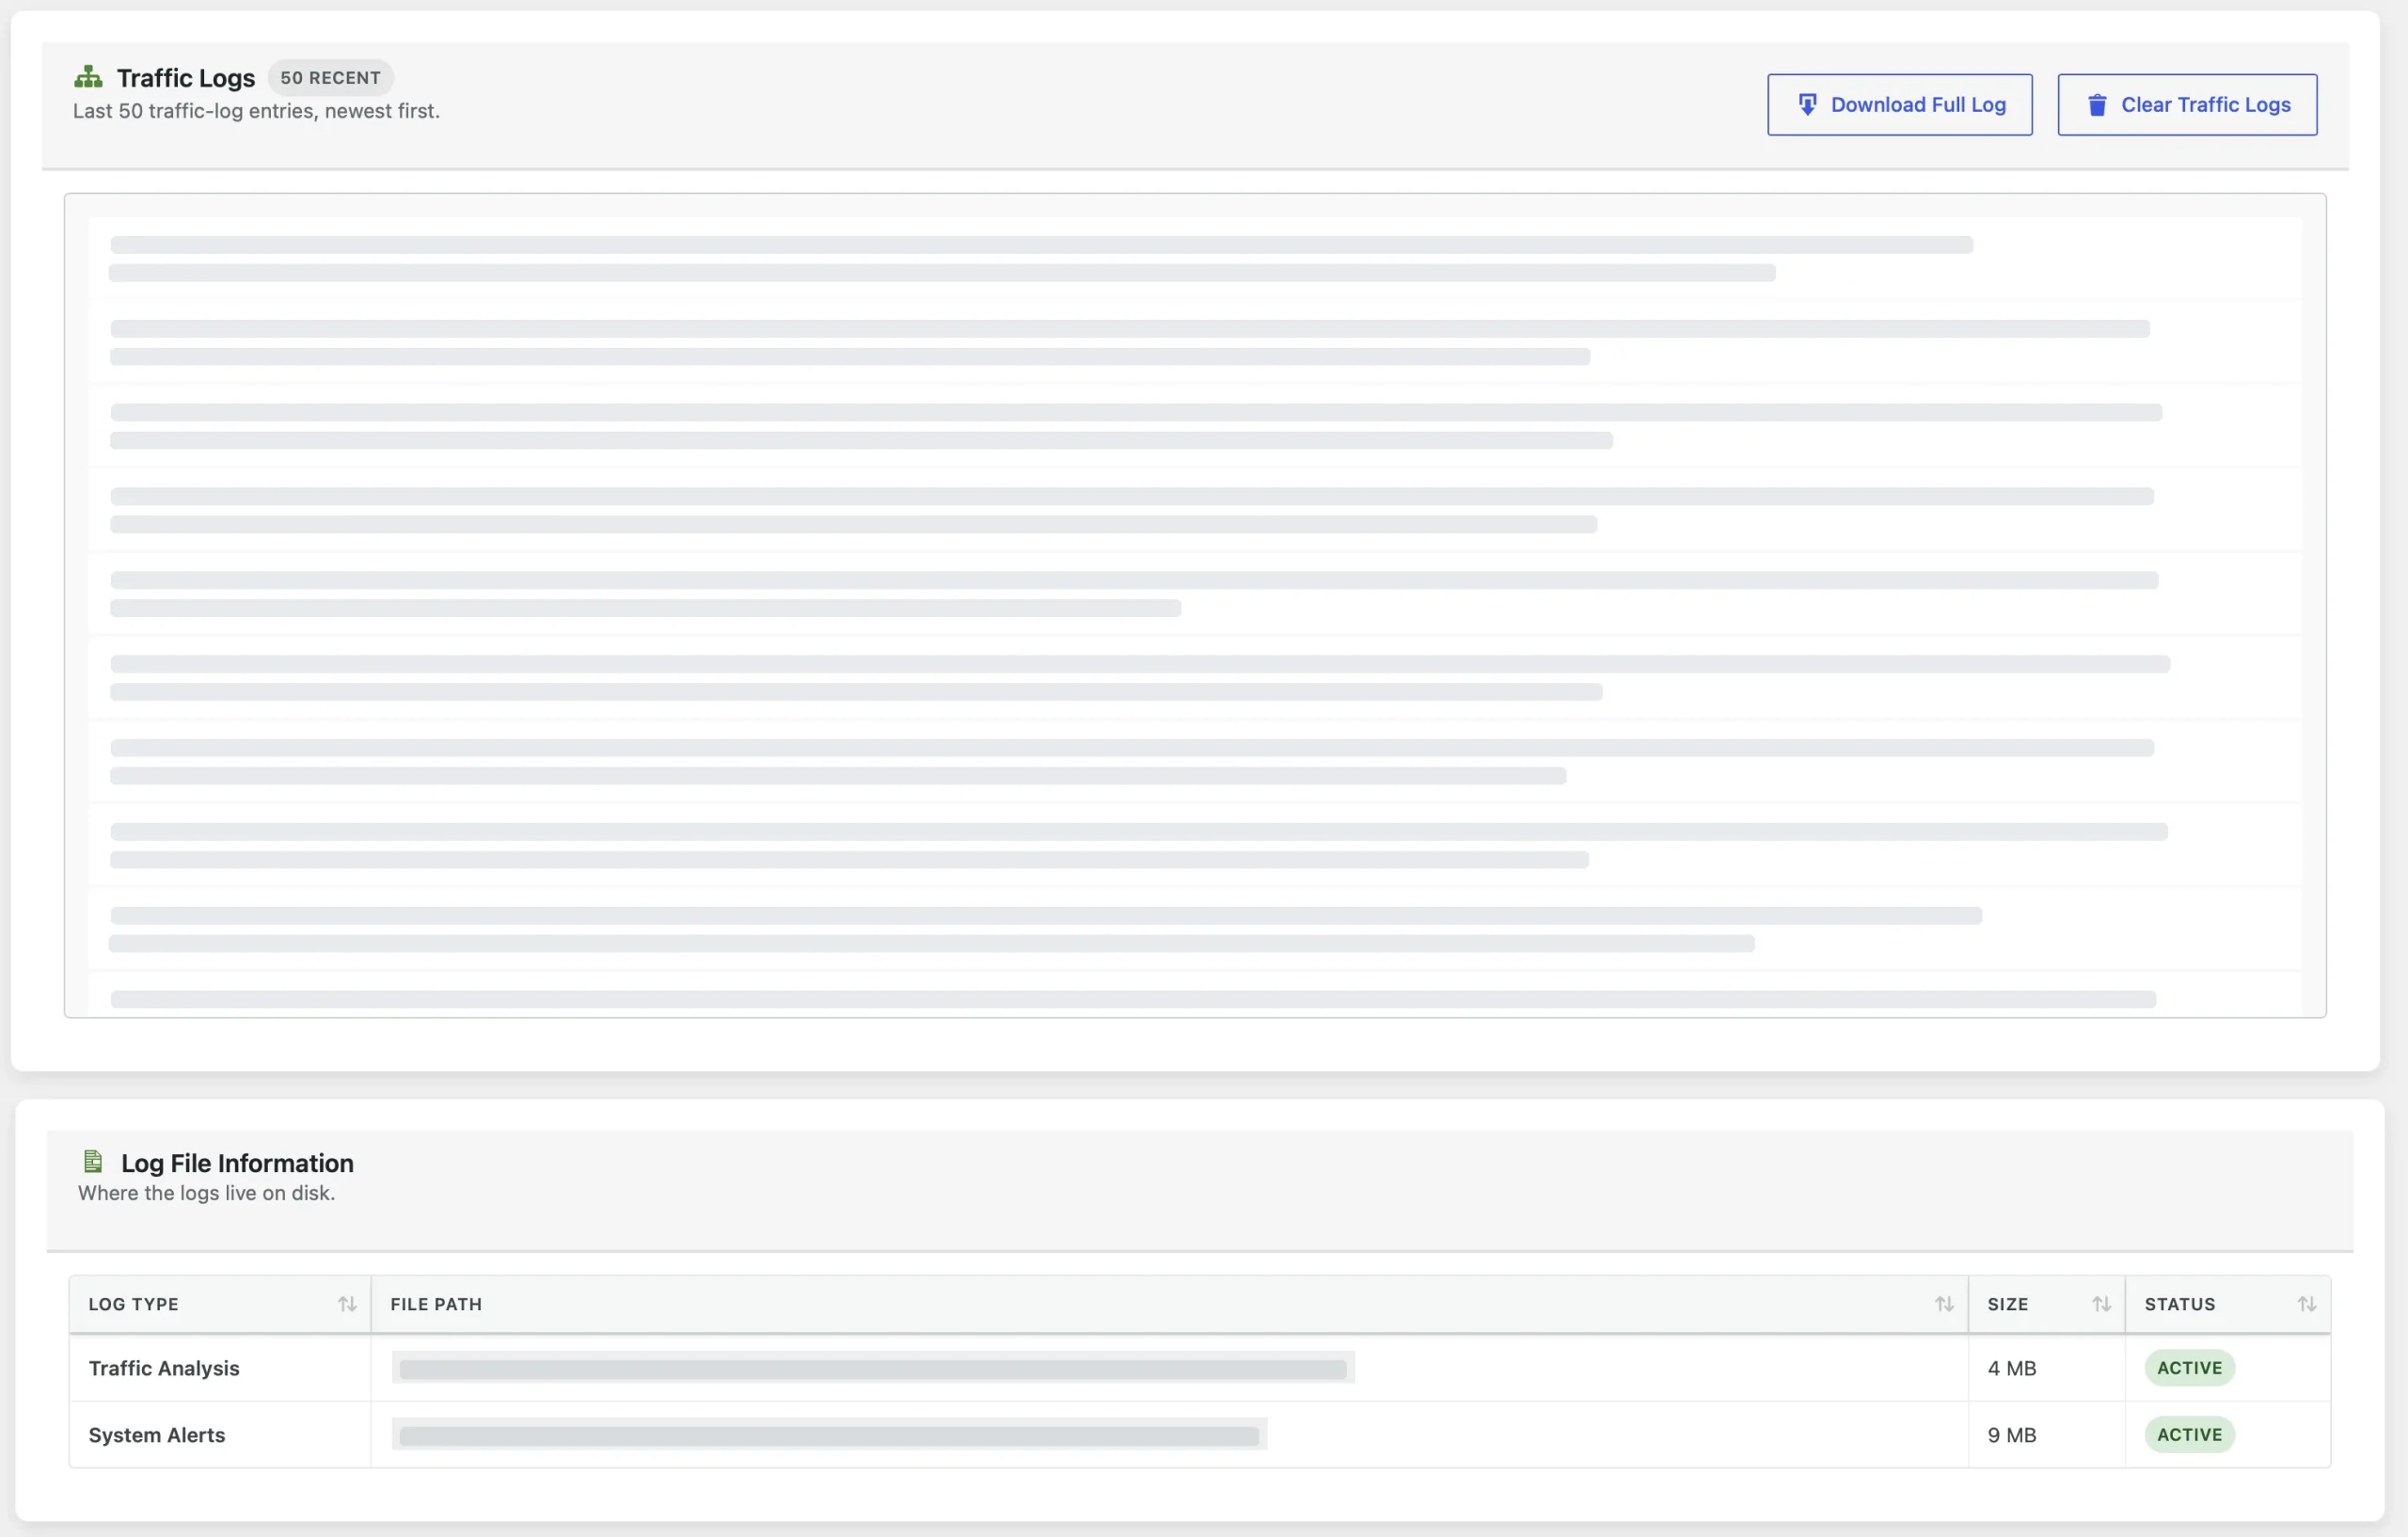
Traffic logs and log files
The traffic log's latest entries, and where both logs live on disk.
- The 50 most recent traffic-log entries, newest first
- Download or clear the traffic log
- Path, size and status for the traffic and alert log files
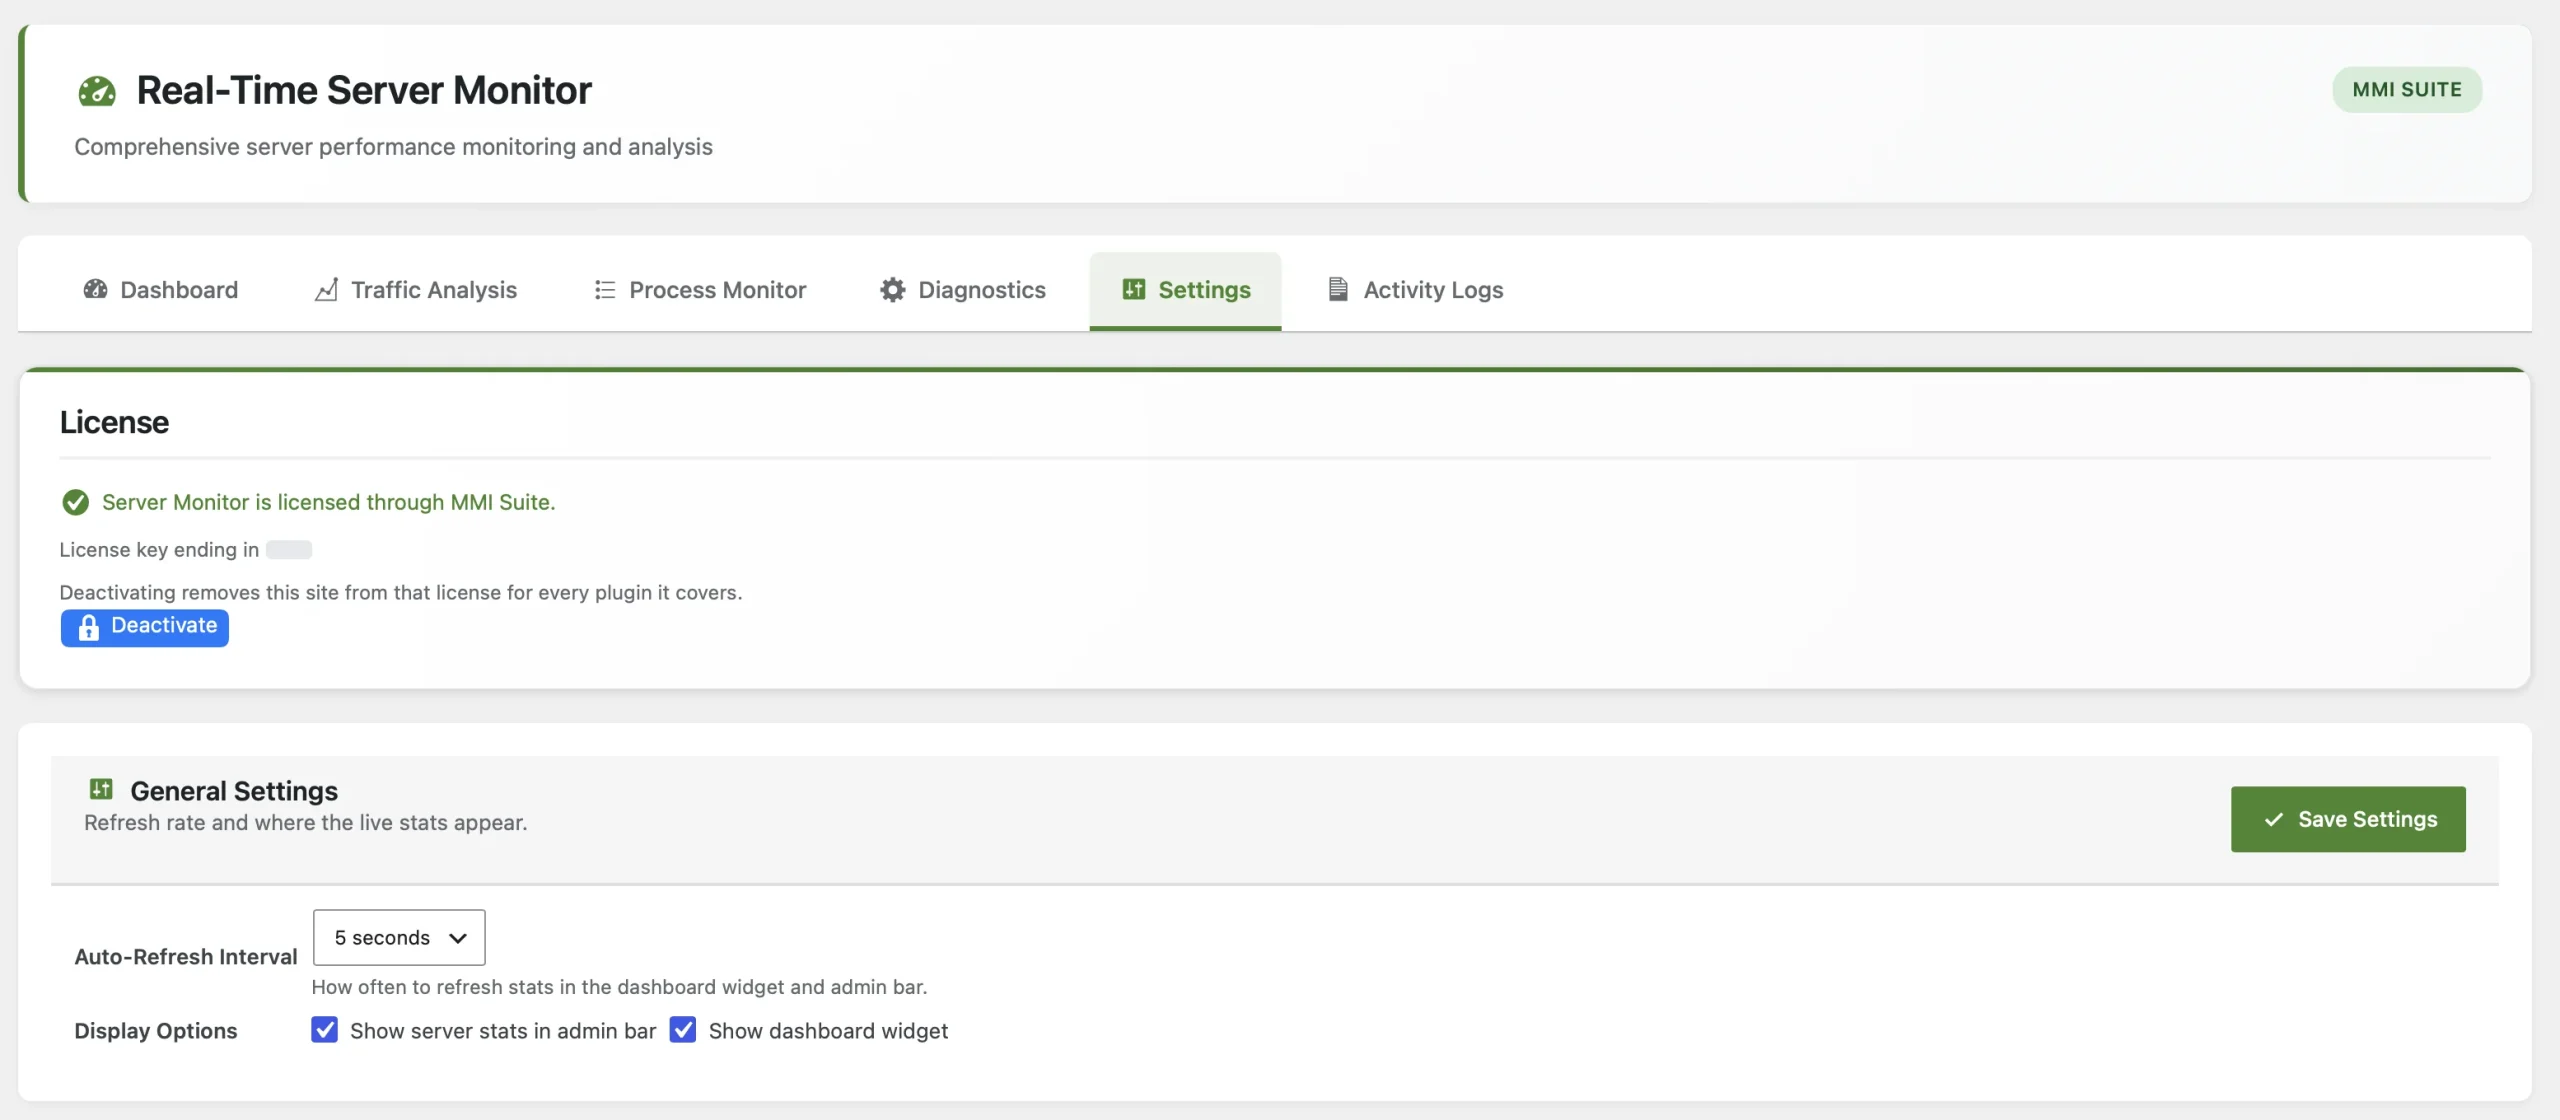
Settings
License, refresh rate, and where the live stats appear.
- License status, including licensing through MMI Suite
- How often the dashboard widget and admin bar refresh
- Turn the admin-bar stats and the dashboard widget on or off
- Where the Visitors count comes from, and the access log to read if it isn't found automatically
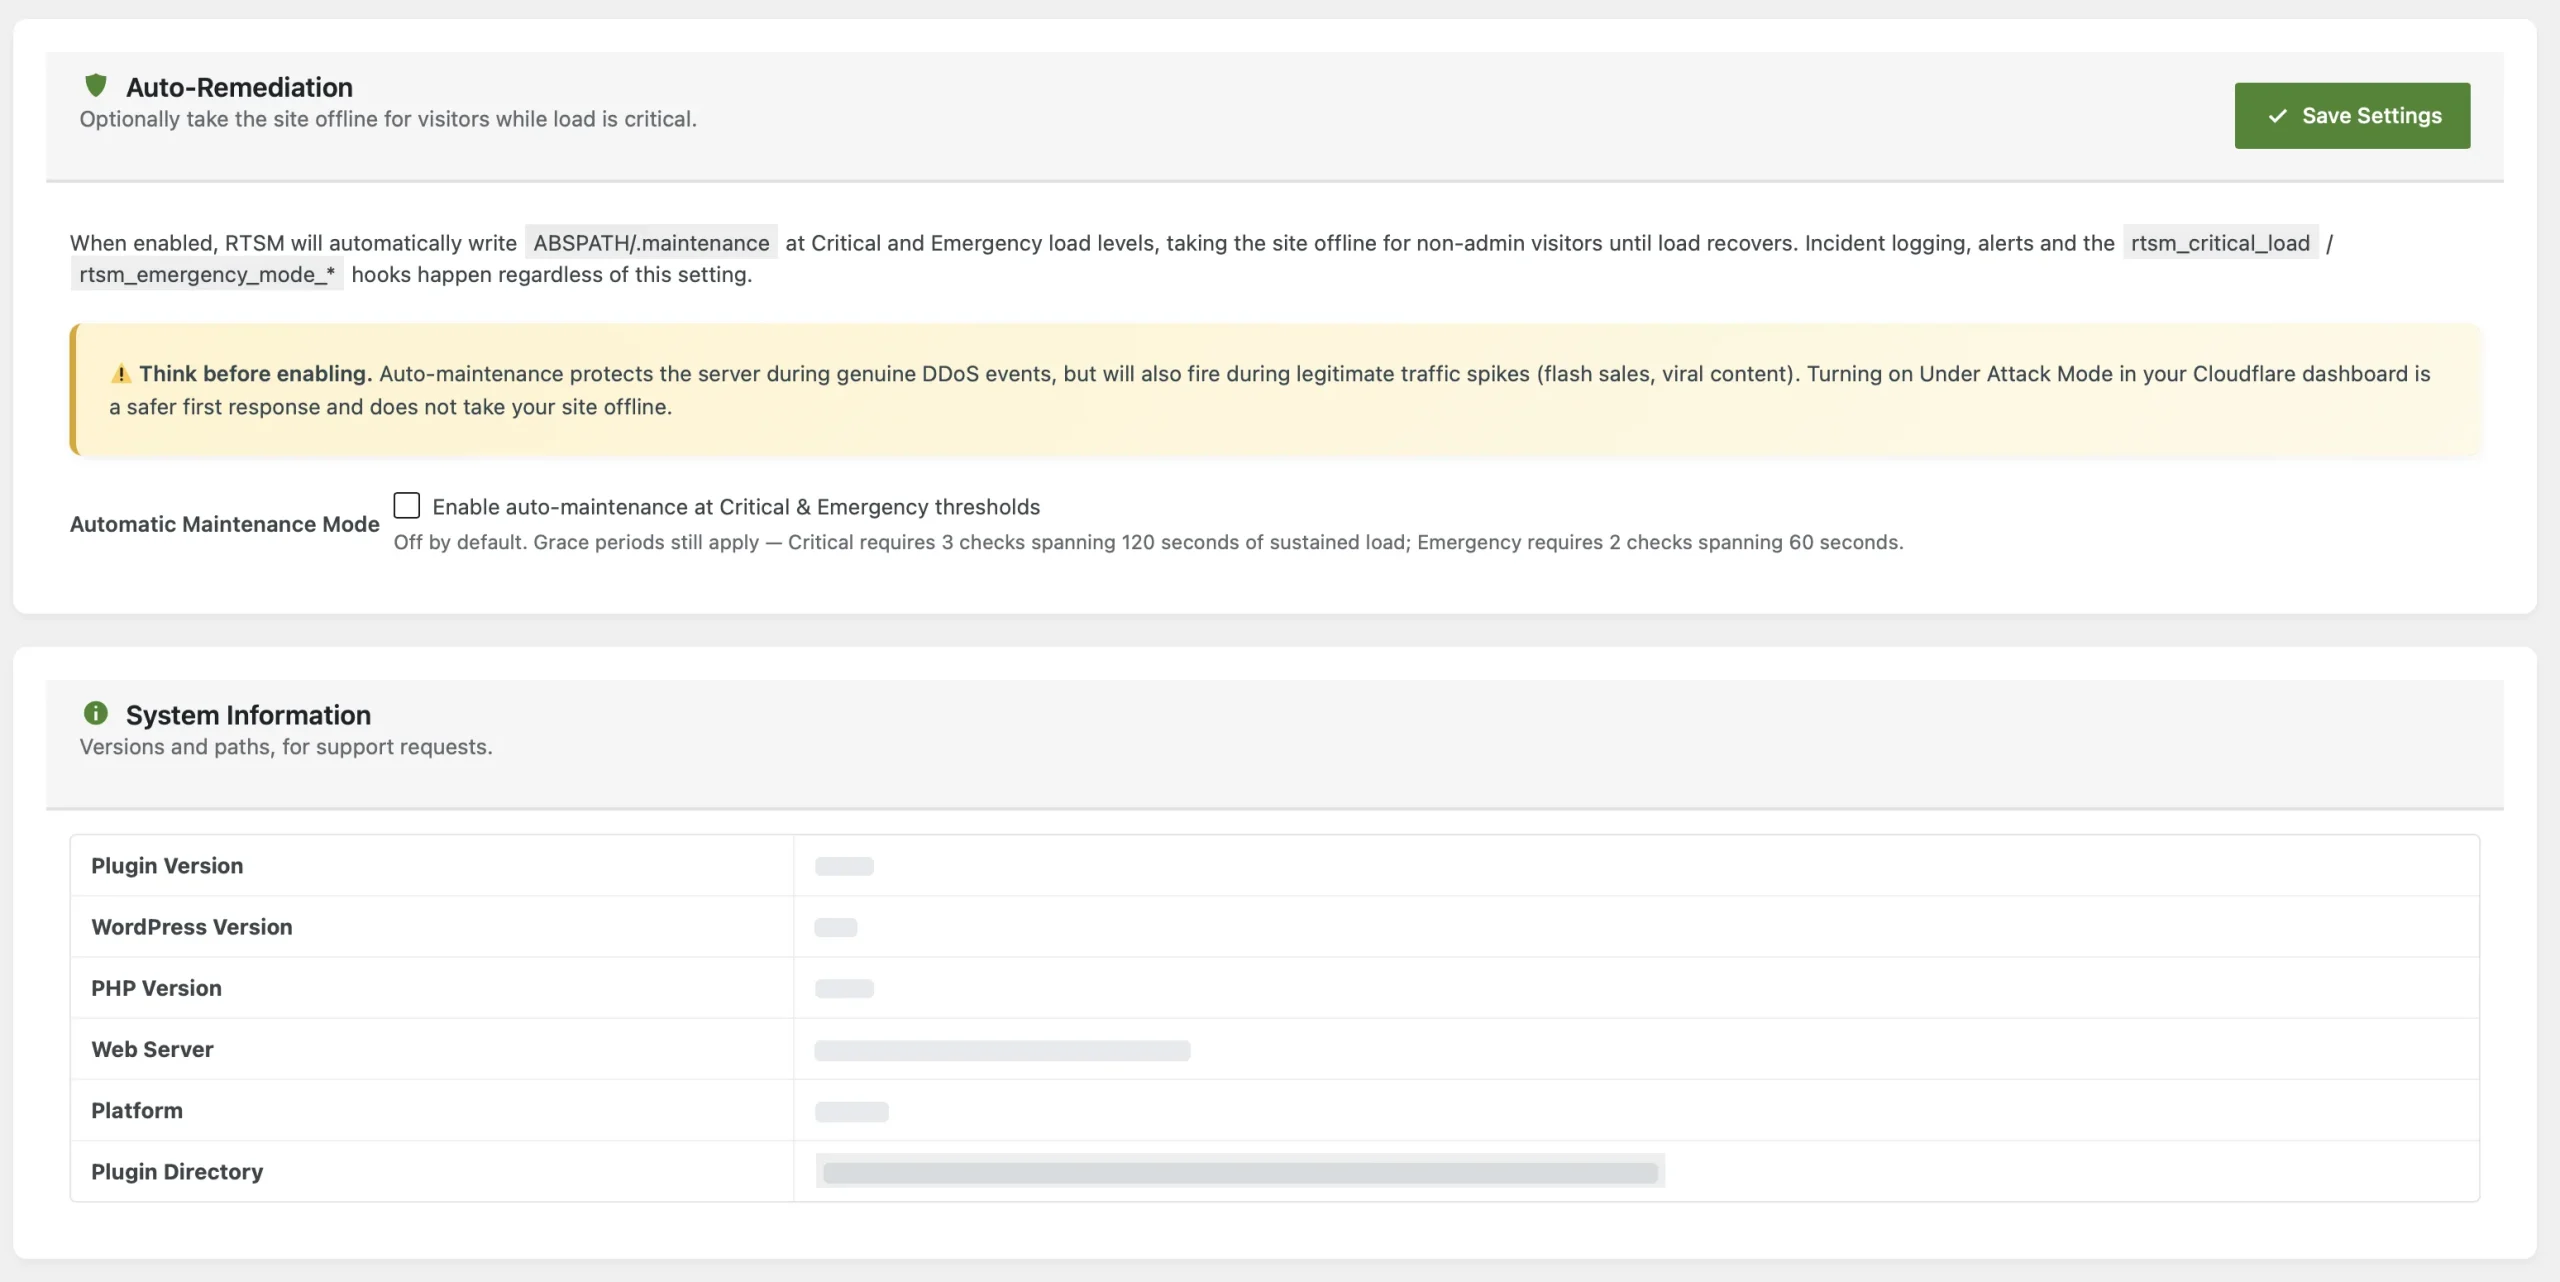
Auto-remediation
Optionally take the site offline for visitors while load is critical.
- Off by default; when on, the site goes into maintenance mode at Critical and Emergency load, for non-admin visitors only, until load recovers
- Grace periods: Critical needs 3 checks over 120 seconds, Emergency 2 checks over 60 seconds
- Logging, alerts and the rtsm_critical_load / rtsm_emergency_mode_* hooks run whether it is on or off
- System information for support requests
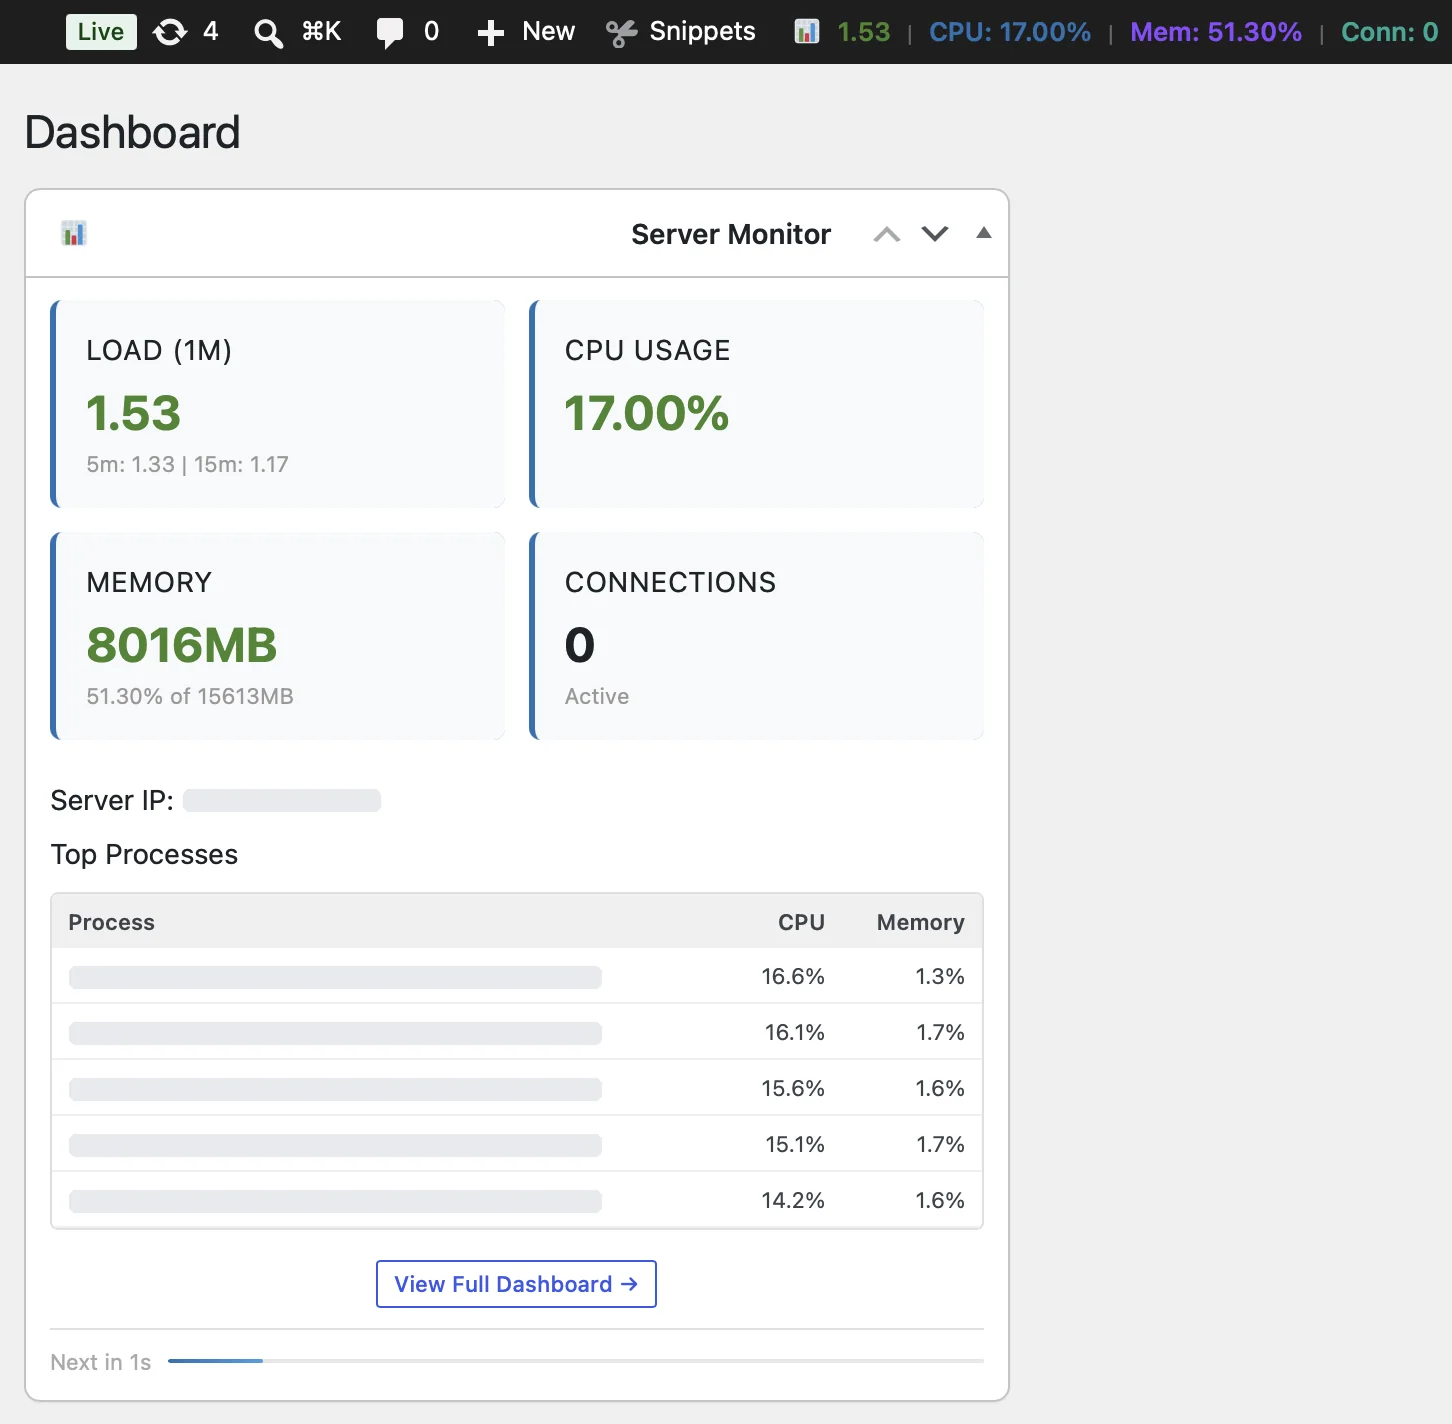
Dashboard widget and admin bar
Live stats on the WordPress dashboard and in the admin bar.
- Load, CPU, memory and visitors in the admin bar, with a warning count when likely bad visitors are on the site
- A dashboard widget with the same stats and the top processes
- A countdown bar to the next refresh
- View Full Dashboard opens the monitor
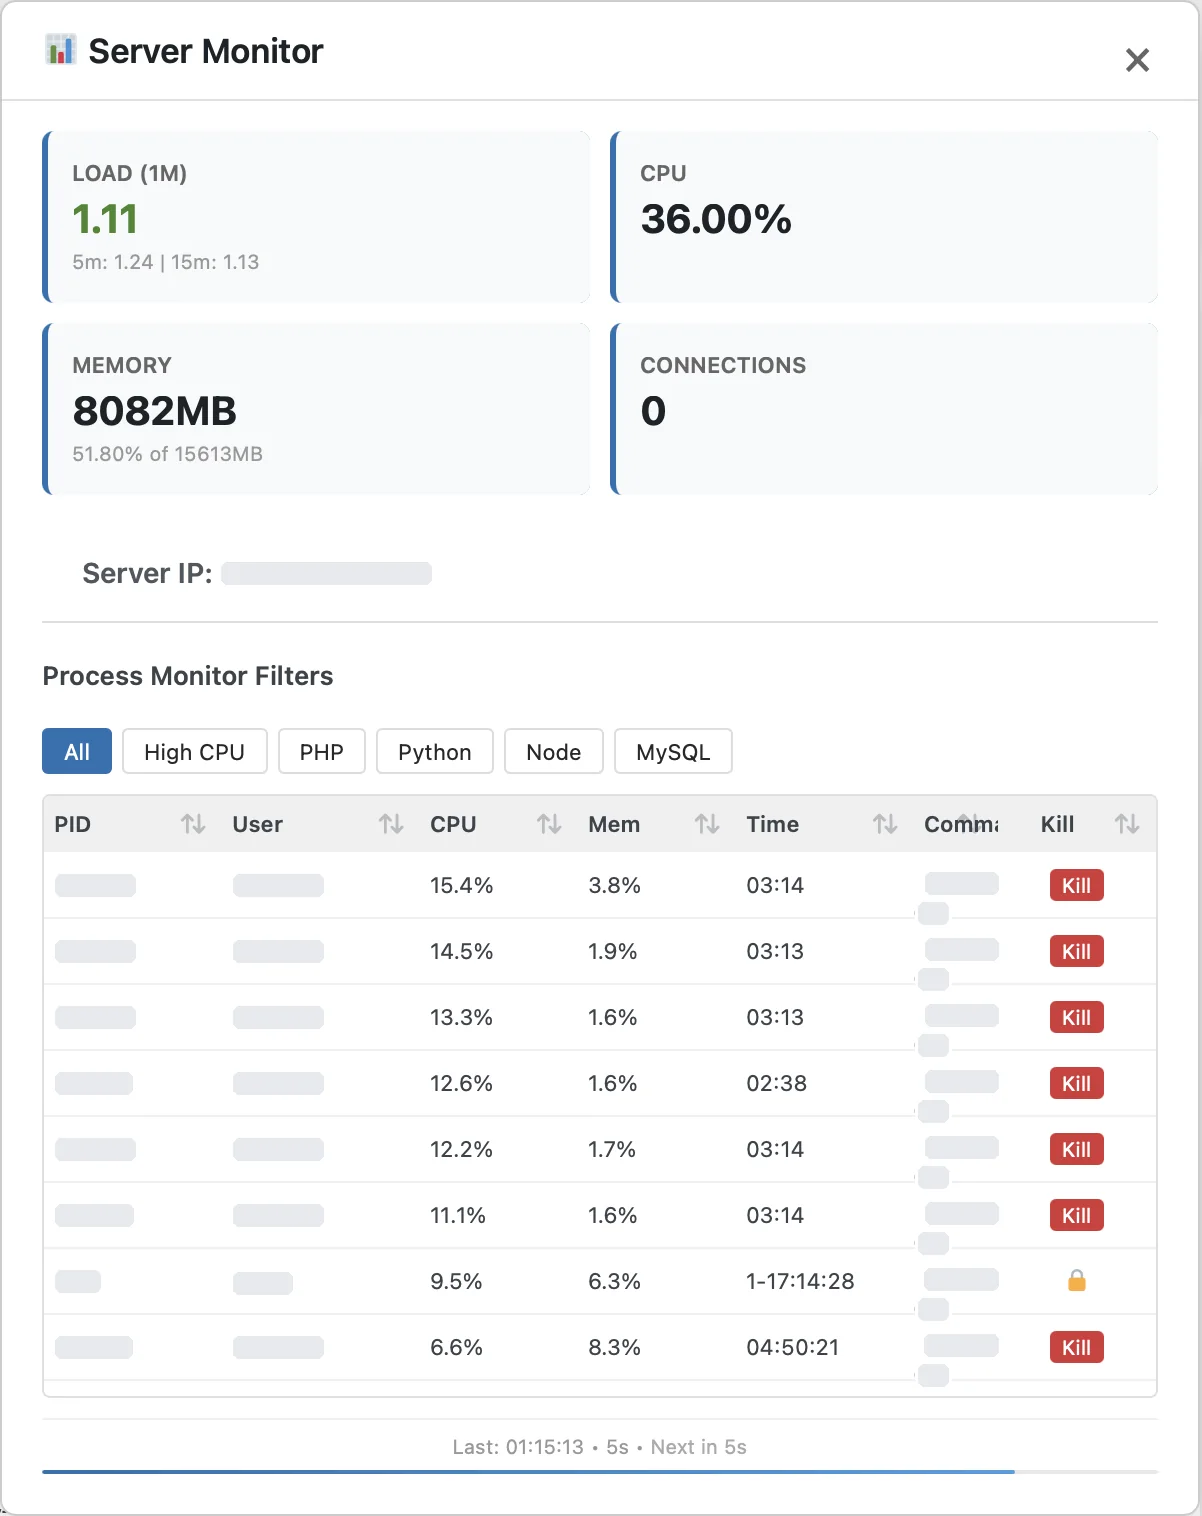
Admin-bar popup
Click the admin-bar stats for a quick look in a popup.
- Load, CPU, memory and visitors, each visitor labelled with the reason on hover
- Filter processes: All, High CPU, PHP, Python, Node or MySQL
- Kill a process from the popup; system processes are locked
- Shows when it last refreshed and counts down to the next refresh
Pricing
Pick your license
Every license is yearly and renews automatically until you cancel. Choose how many sites it covers. Need more later? Upgrade from My Account and the unused part of your year comes off the price. Website Care customers get 25% off the first year, applied at checkout.
Overview
What it does
MMI Real-Time Server Monitor shows what your server is doing right now from inside WordPress: load, CPU, memory, PHP workers and visitors in the last minute. It also points out visitors who look like trouble, so you can see a problem building before your store slows down.
- Live dashboard, with a history of high-load incidents
- Logs every load alert, and emails you when WordPress’s scheduled jobs back up
- Visitors in the last minute, counted from your web server’s log or from the pages WordPress serves, with your own address marked
- Flags likely bad visitors: probing for weak spots, repeated login attempts, fake Google or Bing crawlers
- Copy their addresses, or a ready-made Cloudflare rule to block them
- Works on dedicated, VPS and shared hosting (shows what each host exposes)
Requirements
WordPress 5.9+, PHP 7.4+.
What the license includes
- Updates delivered through WordPress’s own Updates screen, for as long as the license is active
- Renews automatically every year until you cancel; cancelling keeps the license working to the end of the paid year
- Support by email
- Use on 1, 5 or unlimited sites (pick below); move it between sites any time from My Account → Licenses
- GPL-2.0-or-later code
Get started
Up and running in minutes
Buy a license
Choose how many sites it should cover. Your key arrives by email and in My Account → Licenses.
Download and install
Download the ZIP from My Account → Licenses, then upload it under Plugins → Add New → Upload Plugin.
Paste your key
Enter the key in the plugin’s License panel. Updates then arrive through WordPress like any other plugin.
MMI Suite
Works well alongside
Email Customizer
Brand your WooCommerce emails, send automatic sale emails to customers who opted in, and check that your mail reaches inboxes.
Details →Subscriptions
A self-contained subscription engine for WooCommerce: recurring billing, renewals, switching and payment retries.
Details →Distributors
Buy software licenses from XChange, SkuPort and Plugivery for your WooCommerce orders: one queue, one catalog, and nothing bought until you confirm.
Details →Data Pipeline
Import and export any WordPress or WooCommerce data on a schedule. Product imports show every change for review first.
Details →Store Suite
All five MMI plugins under one license: Data Pipeline, Distributors, Subscriptions, Email Customizer and Real-Time Server Monitor.
Details →Questions before you buy?
Ask us whether Real-Time Server Monitor fits your store. We use it every day.